The Edge
Know What They Know
🐷 PIG ROAST
💬 Word on the Street
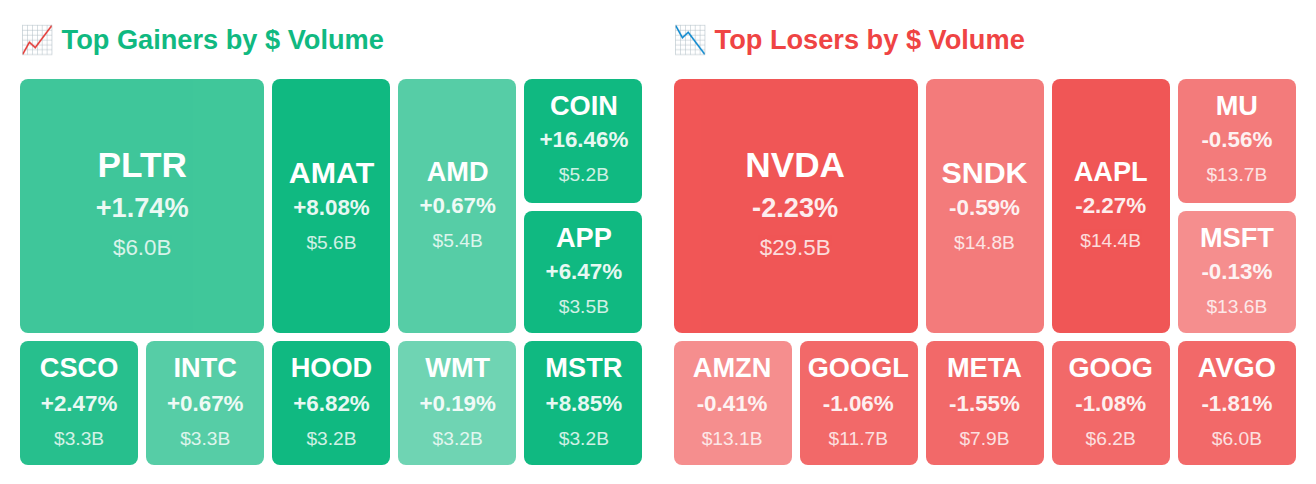
While Rep. Michael McCaul (R-TX) quietly scooped up MercadoLibre (MELI) shares and the Fed pumped $16.5B into the system, six insiders at Diamondback Energy (FANG) sprinted for the exits with $342.0M in stock sales—the kind of timing that makes you wonder what they're seeing that we're not. After hours, the real fireworks erupted: Rivian Automotive (RIVN) rocketed 27% on an earnings beat while Coinbase Global (COIN) doubled down on Bitcoin at $164 as it bleeds 40% year-to-date, and Nebius Group (NBIS) rode an 800% AI cloud surge to a 9% pop. Here's what smart money is doing today.
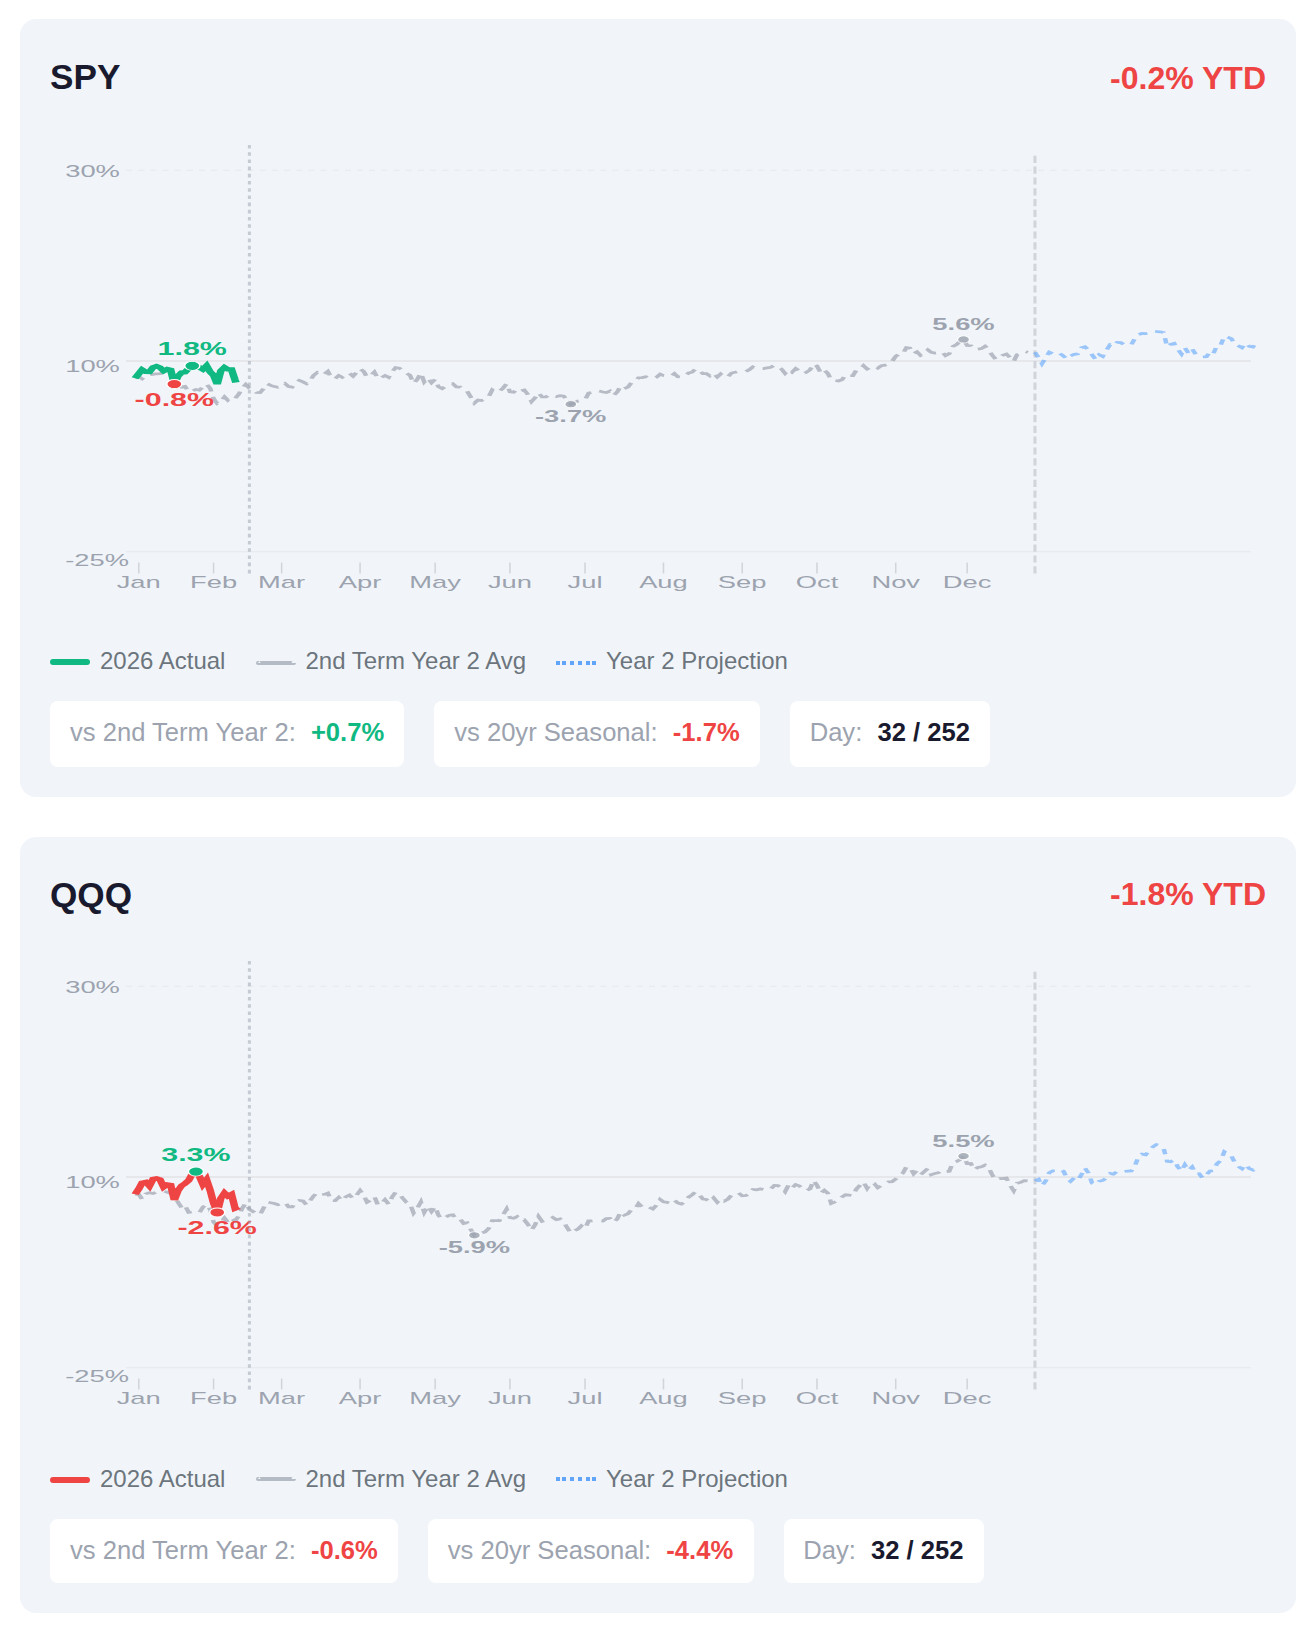
We're 32 trading days into the second year of Trump's second term, and markets are tracking slightly ahead of the typical Year 2 pattern—SPY sits just 0.7% above its historical average for this point in the cycle, though it's lagging the broader 20-year seasonal trend by 1.7%. The tech-heavy QQQ is running 0.6% below its Year 2 historical comp, which isn't unusual given that midterm policy uncertainty tends to create choppiness in growth names during this phase. If the pattern holds, Year 2 tends to deliver modest gains around 3.5% for the full year with another 1.5% typically materializing by mid-March, though the first quarter of these cycles has historically been more about consolidation than acceleration.
📚 Jargon Buster
Correlation
How much stocks move together. Correlation 1.0 = they’re all holding hands. Breaks down = some get rich, most get carried out.
The VIX declined 5.3% this week to 17.65, remaining within the normal range and suggesting measured uncertainty in equity markets, while the MOVE index dropped more sharply by 15.7% to 11.77, indicating particularly subdued expectations for bond market volatility. This divergence shows fixed income traders pricing in minimal Treasury volatility even as equity volatility holds at moderate levels. The current readings reflect neither complacency nor heightened stress, with stocks showing typical fluctuation expectations and bonds exhibiting unusually calm conditions.

|| Market Sutra ||
"The market reveals character faster than adversity does."
— Traders who broke discipline in 2008 never recovered their confidence.
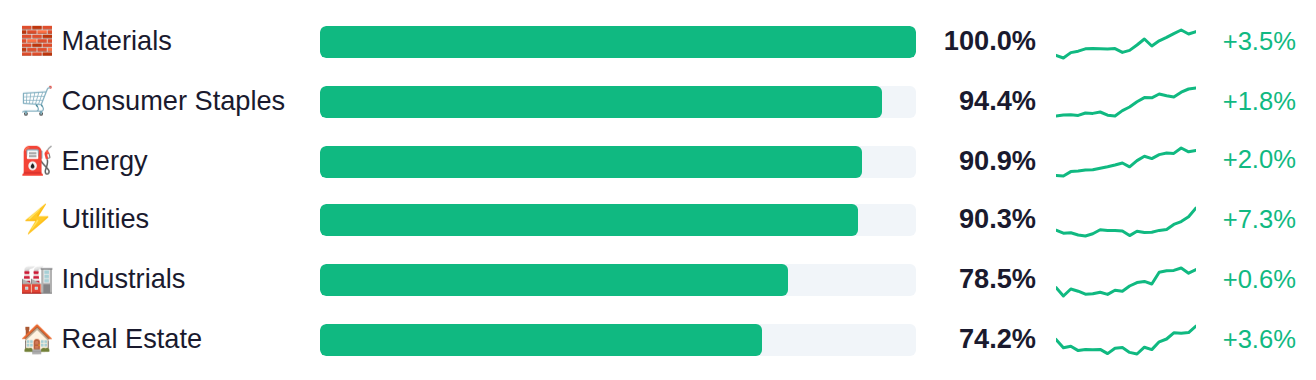
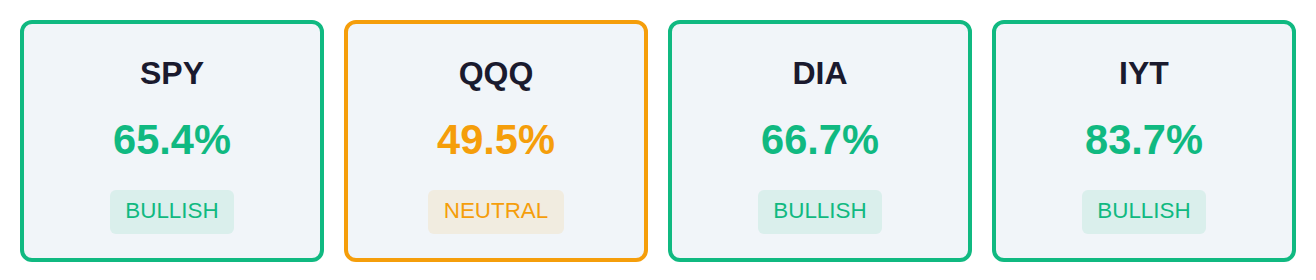
Market breadth shows a notable divergence, with traditional defensive and commodity-linked sectors leading as Materials, Consumer Staples, and Energy demonstrate the strongest relative performance above 90%, while growth-oriented sectors including Technology, Financials, and Communication Services lag significantly in the 35-46% range. The breadth data across major indices reveals further dispersion, as the transport-heavy IYT posts 84% breadth while the tech-concentrated QQQ registers just 50%, suggesting a rotation away from large-cap technology names that have dominated in recent periods. This combination of defensive sector leadership and narrow technology participation typically reflects investors repositioning toward more economically sensitive areas while reducing exposure to higher-valuation growth stocks.
As of February 11, Fed net liquidity stands at $6.62 trillion, up $16.5 billion week-over-week, with the next H.4.1 report scheduled for Thursday, February 19. This expansion in liquidity typically correlates with increased support for risk asset prices, as more available capital in the financial system has historically reduced funding stress and supported equity valuations.
Yesterday's housing market data showed significant weakness as existing home sales plunged to 3.91M from 4.27M prior, missing estimates of 4.2M with an 8.4% monthly decline that was more than double the expected 3.4% drop—marking one of the lowest sales rates since the 2010-2011 period when the market was still recovering from the financial crisis. Jobless claims edged slightly higher to 227K versus 225K expected but remain at historically low levels, indicating labor market resilience even as housing deteriorates under elevated mortgage rates. This morning's inflation data delivered a mixed picture with headline CPI showing 2.4% year-over-year as expected, but core CPI's monthly increase of 0.3% versus 0.2% expected signals persistent underlying price pressures that may complicate the Fed's rate-cut calculus, while speculative positioning data shows large traders remain net short S&P 500 futures at -105.1K contracts though less bearish than the prior week's -132.9K.
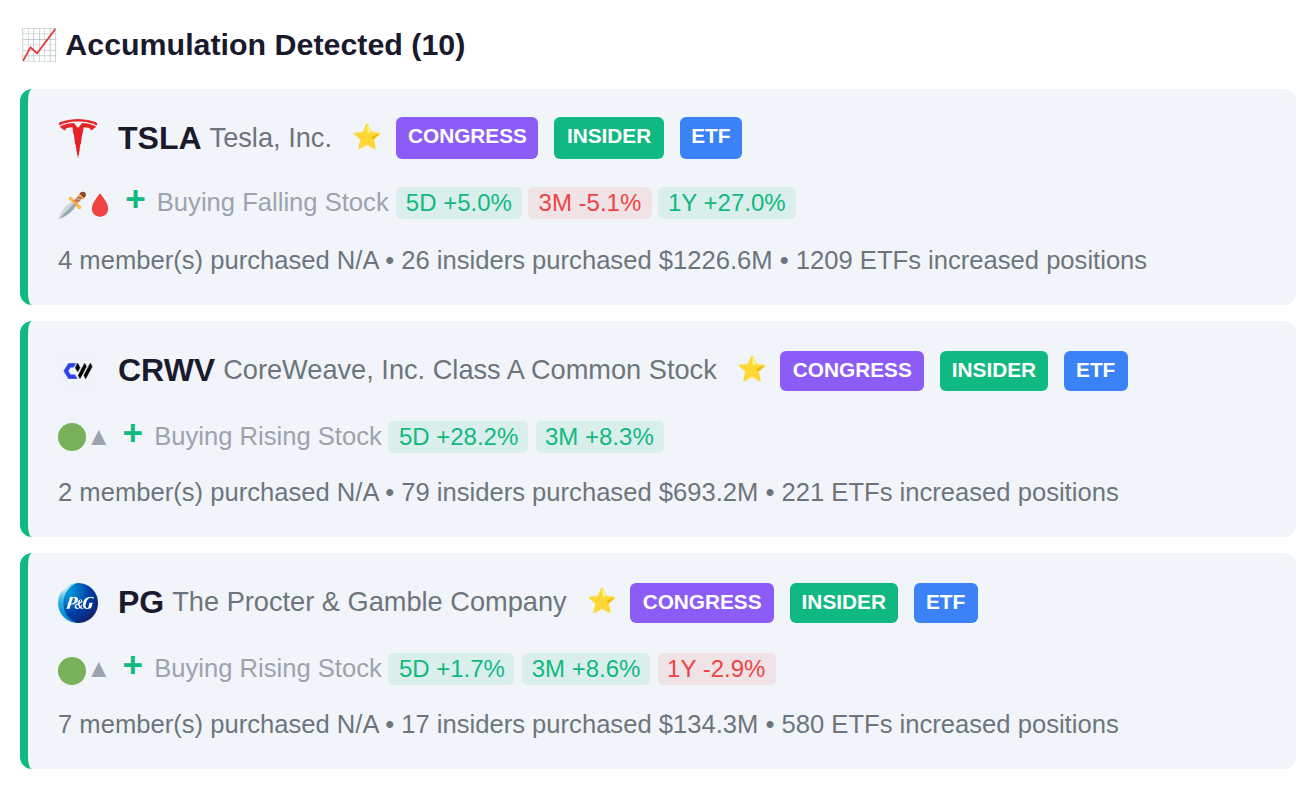
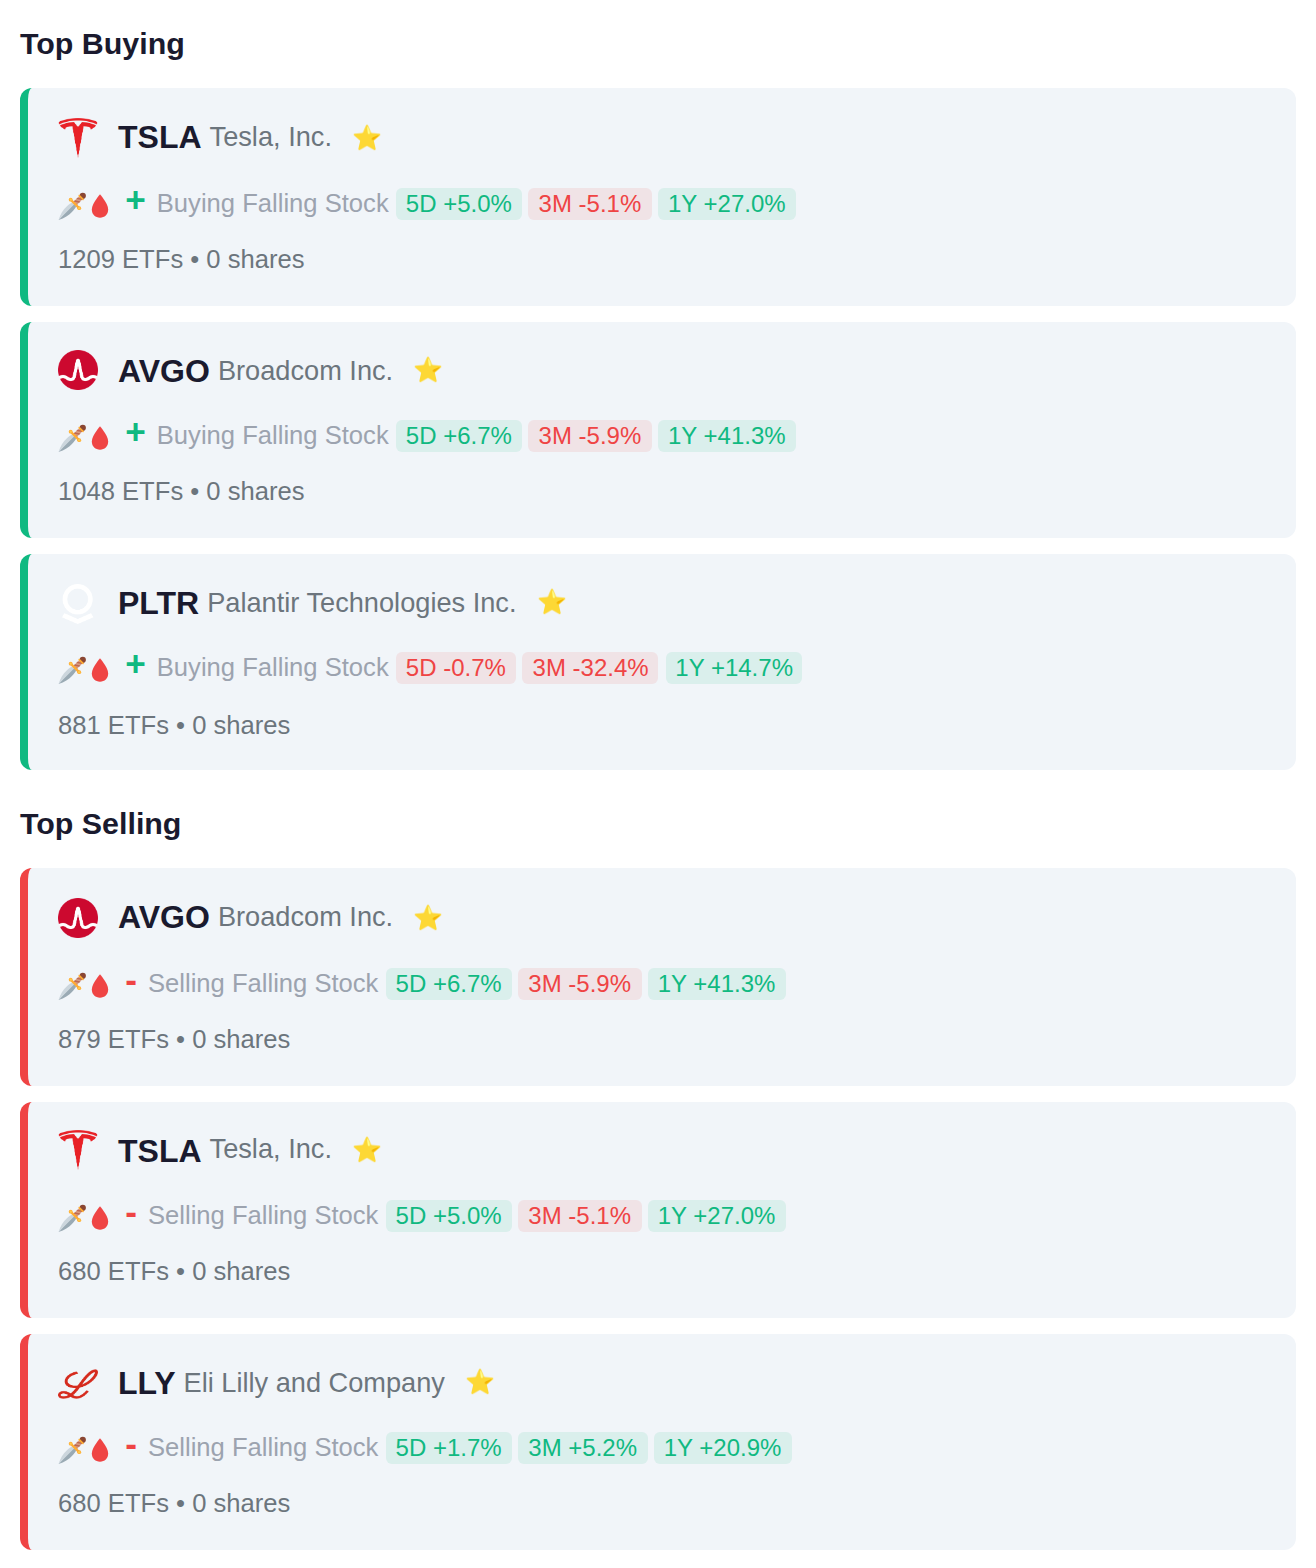
Institutional flows this period showed conflicting signals as technology names dominated both sides of the ledger, with 1,209 ETFs adding TSLA positions while 680 removed them, and AVGO seeing similar two-way activity (1,048 adding, 879 removing), suggesting active rebalancing rather than directional sector rotation. The only clear exit trend emerged in healthcare, where 680 ETFs reduced LLY exposure, while defense technology name PLTR saw net accumulation across 881 funds.
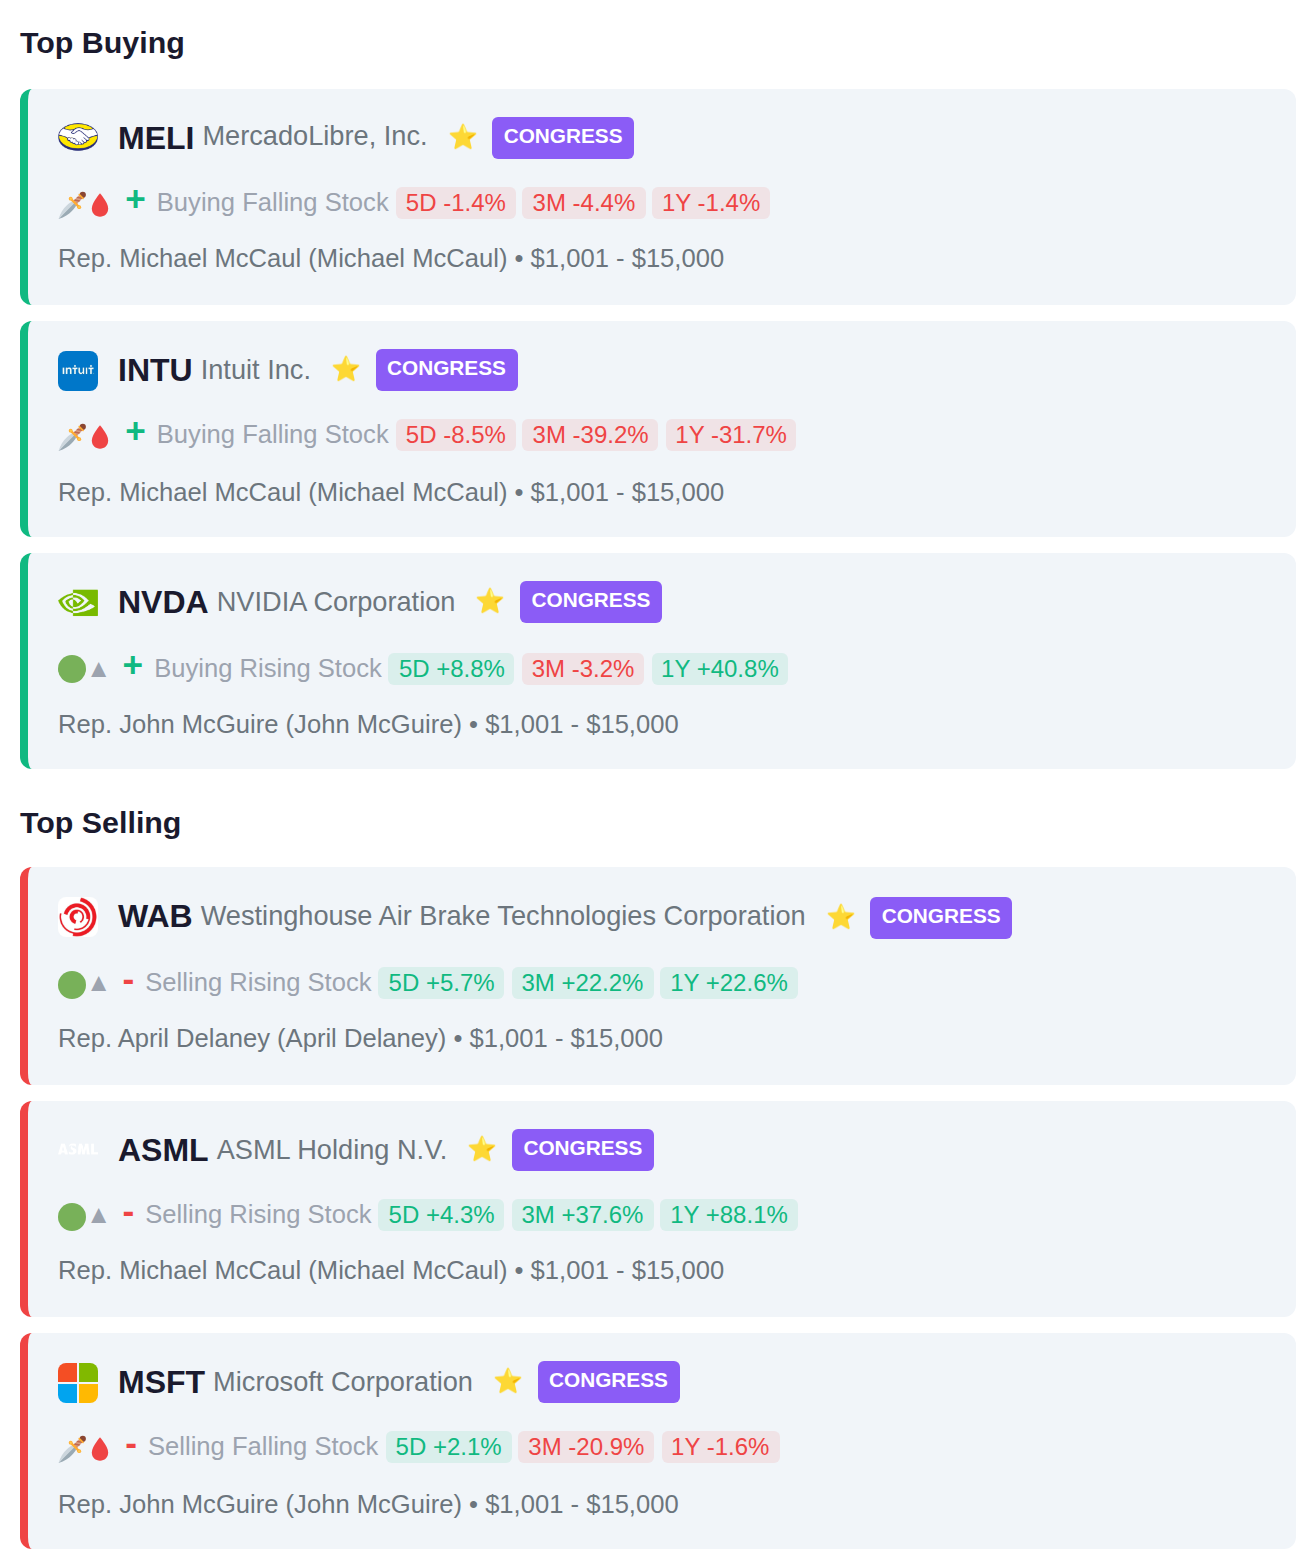
Congressional members reported several technology-sector transactions, with Rep. Michael McCaul purchasing e-commerce platform MELI and financial software company INTU while selling semiconductor equipment maker ASML. Rep. John McGuire added chipmaker NVDA but reduced his position in MSFT, while Rep. April Delaney sold rail equipment manufacturer WAB.
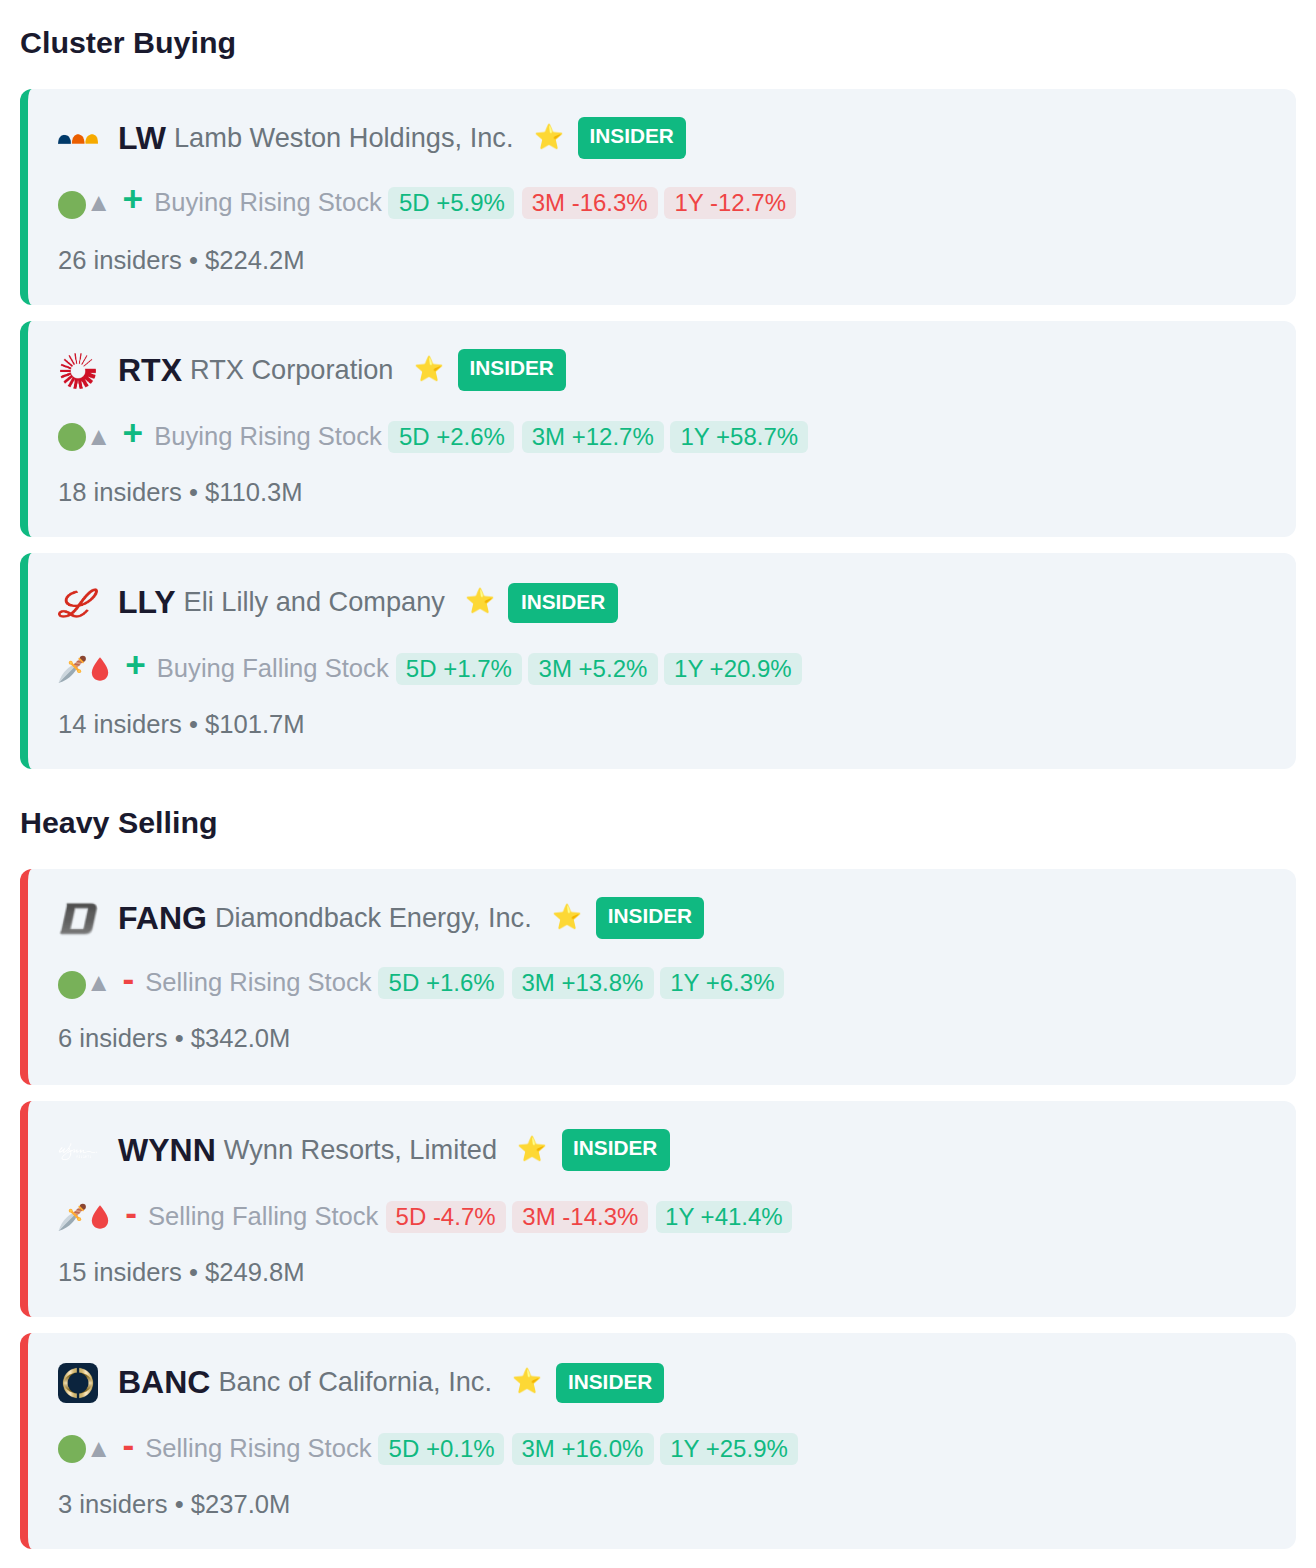
Lamb Weston (LW) saw 26 insiders receive awards or purchase shares, followed by RTX with 18 insiders and Eli Lilly (LLY) with 14 insiders adding positions. On the selling side, 15 insiders at Wynn Resorts (WYNN) collectively disposed of $249.8 million in shares, while 6 insiders at Diamondback Energy (FANG) sold a combined $342.0 million and 3 insiders at Banc of California (BANC) reduced positions totaling $237.0 million.
Yesterday's session saw notable volatility with TNET declining 27.6% while KUBTY surged 26.9% and IRM advanced 19.1%. Today's earnings calendar features 229 companies reporting, with accumulation signals appearing in 8766.T and 7182.T, while distribution signals have emerged in 298380.KQ and 4543.T ahead of their results. Tomorrow's slate includes 215 companies scheduled to report quarterly results.