The Edge
Know What They Know
🐷 PIG ROAST
💬 Word on the Street
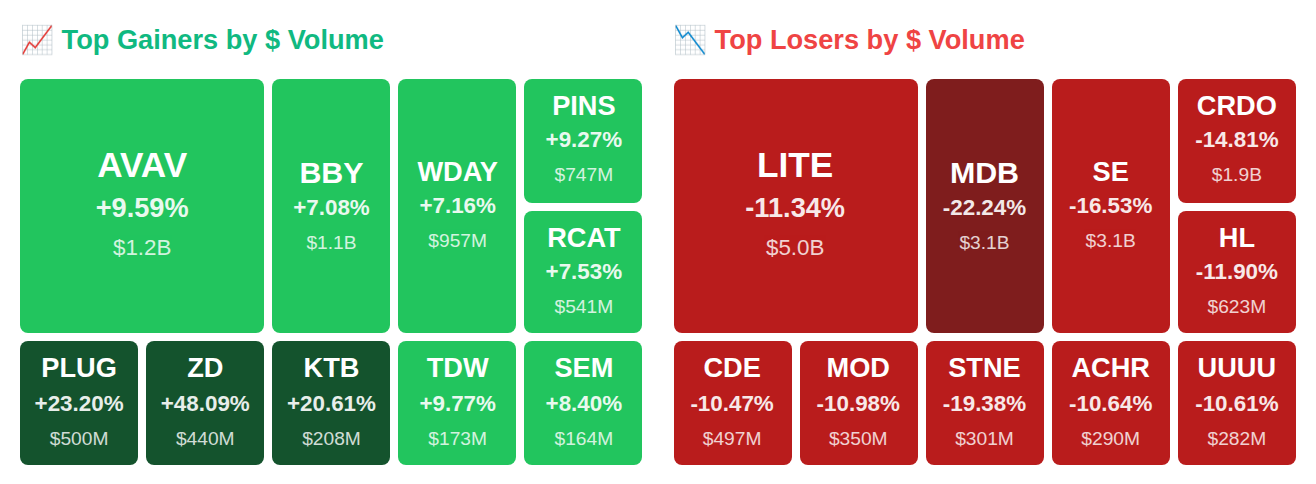
While Rep. Virginia Foxx purchased Alliance Resource Partners LP (ARLP) in the $1,001 to $15,000 range, 63 insiders at Royal Caribbean Cruises Ltd. (RCL) collectively dumped $458.4 million worth of shares—the kind of exodus that makes you wonder what they're seeing on the horizon. After hours, Kontoor Brands Inc. (KBI) surged 20.6% to $78.18 on a monster earnings beat, Tidewater Inc. (TDW) jumped 9.8% to $87.67 after quadrupling expected EPS, and Ingram Micro Holding Corporation (INGM) rocketed 14.3% to $24.41 on a fresh buyback authorization, while overall smart money posted a $725.8 million net outflow with $2.1 billion in sales swamping $1.4 billion in purchases. Here's what smart money is doing today.
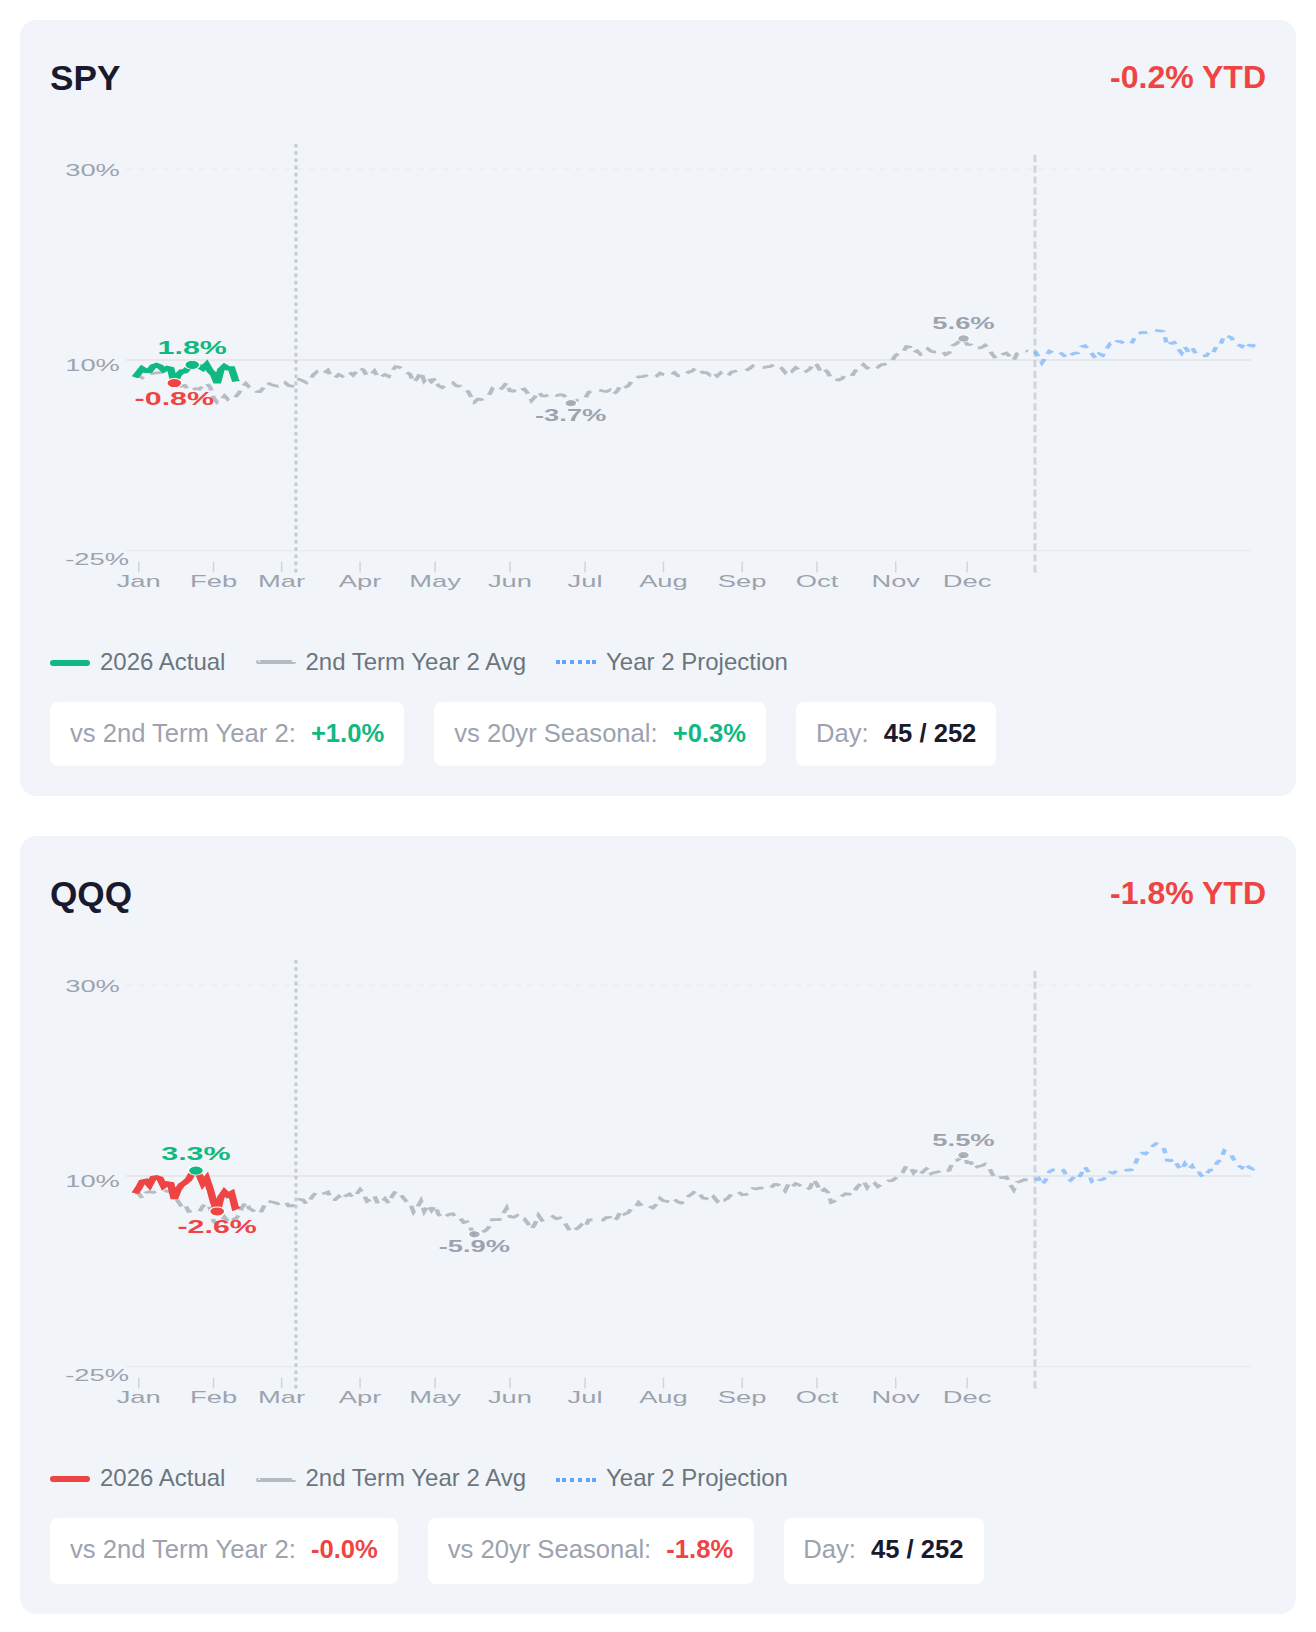
We're 45 days into Year 2 of Trump's second term, and equities are running slightly ahead of the typical second-year script—SPY is tracking 1% above the historical average for this point in the cycle, though it's worth noting that Year 2 tends to be the weakest of the four-year pattern with full-year gains averaging just 3.5%. The seasonal data suggests another 1.5% could materialize by mid-March if this year follows the typical Q1 trajectory, though QQQ is currently flat versus its historical Year 2 benchmark while SPY shows modest outperformance. Smart money will be watching whether the current positioning holds through the traditionally choppier summer months that tend to characterize midterm years before the typical late-year rally into Year 3, which historically has been the strongest performer in the presidential cycle.
📚 Jargon Buster
Yield
The little treat your money gets for sitting still. Bonds, dividends, staking—basically interest but sexier.
Equity volatility remains elevated with the VIX at 21.44, reflecting continued investor uncertainty in stock markets, though the 2.0% weekly increase suggests fear levels are holding relatively steady rather than accelerating. In contrast, bond market volatility told a different story as the MOVE index jumped 29.3% week-over-week to 13.74, though it remains at historically low absolute levels, indicating fixed income traders are beginning to price in more uncertainty after an extended period of calm. The divergence between elevated equity volatility and still-subdued bond volatility suggests investors are navigating mixed signals about economic conditions and policy outlooks.

|| Market Sutra ||
"Low conviction creates high volatility."
— 2015–2016 chop reflected uncertainty around China and oil.
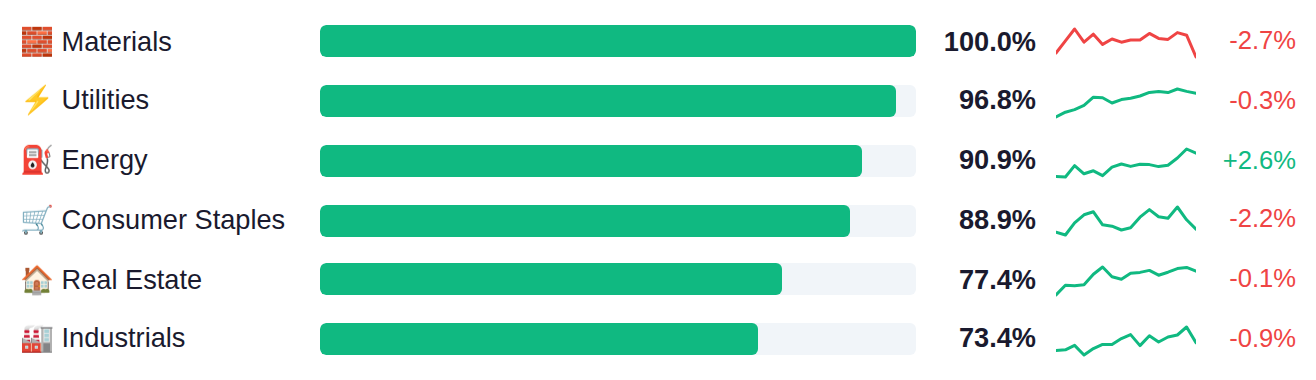
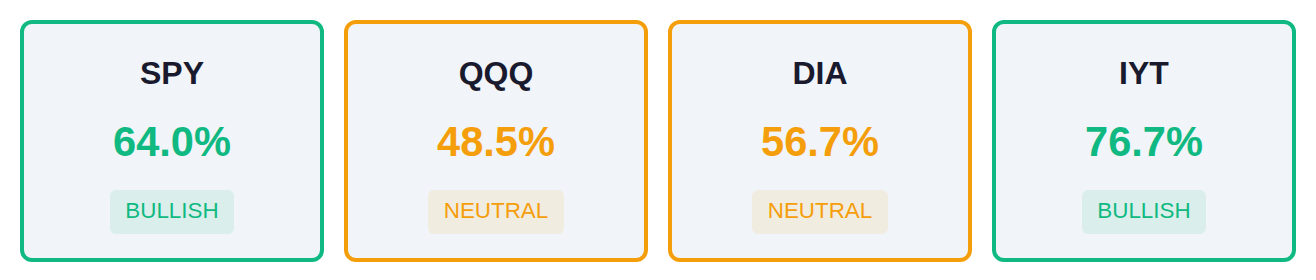
Traditional value sectors are showing unusual strength, with Materials, Utilities, and Energy leading the market while growth-oriented sectors like Technology and Communication Services lag significantly behind. The breadth divergence is notable, as the transport-heavy IYT displays stronger participation at 77% compared to the tech-concentrated QQQ at just 48%, suggesting institutional rotation into economically sensitive and defensive areas. This positioning indicates a shift away from the growth trade that dominated recent years, with money flows favoring companies tied to physical assets and infrastructure over digital platforms.
# Fed Liquidity Update As of February 25, the Fed's net liquidity stands at $6.61 trillion, up $0.4 billion from the prior week, indicating essentially flat conditions in the financial system's available liquidity. The next H.4.1 report releases Thursday, March 5, which will show whether this stability continues or if the Fed's balance sheet operations shift market liquidity levels in either direction.
Yesterday's API crude oil inventory data showed stockpiles rose by 5.6 million barrels, a notable deceleration from the prior week's 11.4 million barrel build, suggesting demand may be stabilizing after last week's outsized accumulation. Today's calendar centers on the ISM Services PMI (expected at 53.5 versus 53.8 prior) and the prices paid component that held at an elevated 66.6 last month—traders will be parsing whether services inflation pressures are finally easing after that reading marked one of the highest prints since mid-2022. Tomorrow's initial jobless claims forecast of 215,000 versus 212,000 prior and the Q4 productivity revision (4.0% expected versus 4.9% prior) will test whether the labor market remains tight enough to keep the Fed hawkish, while unit labor costs are projected to improve to -0.7% from -1.9%, which would represent the second consecutive quarterly decline and the best back-to-back performance since 2020.
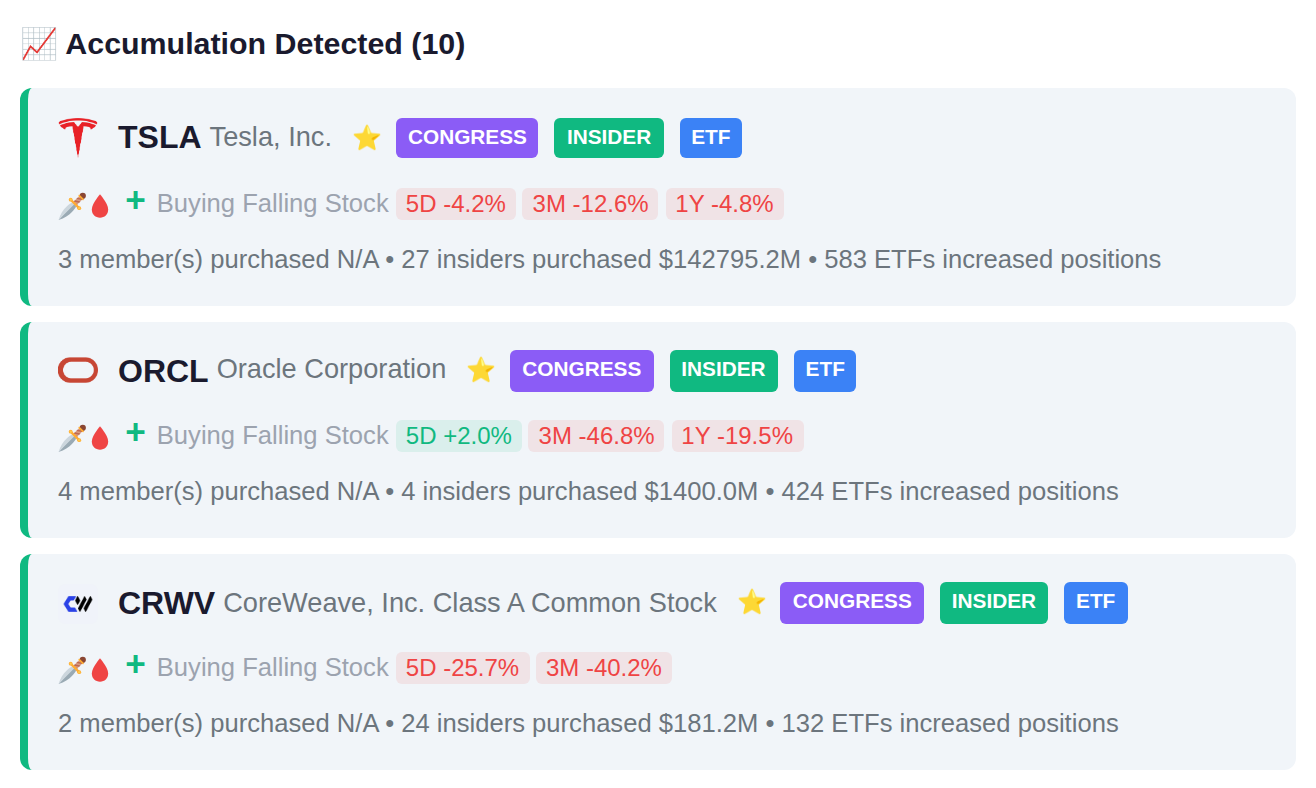
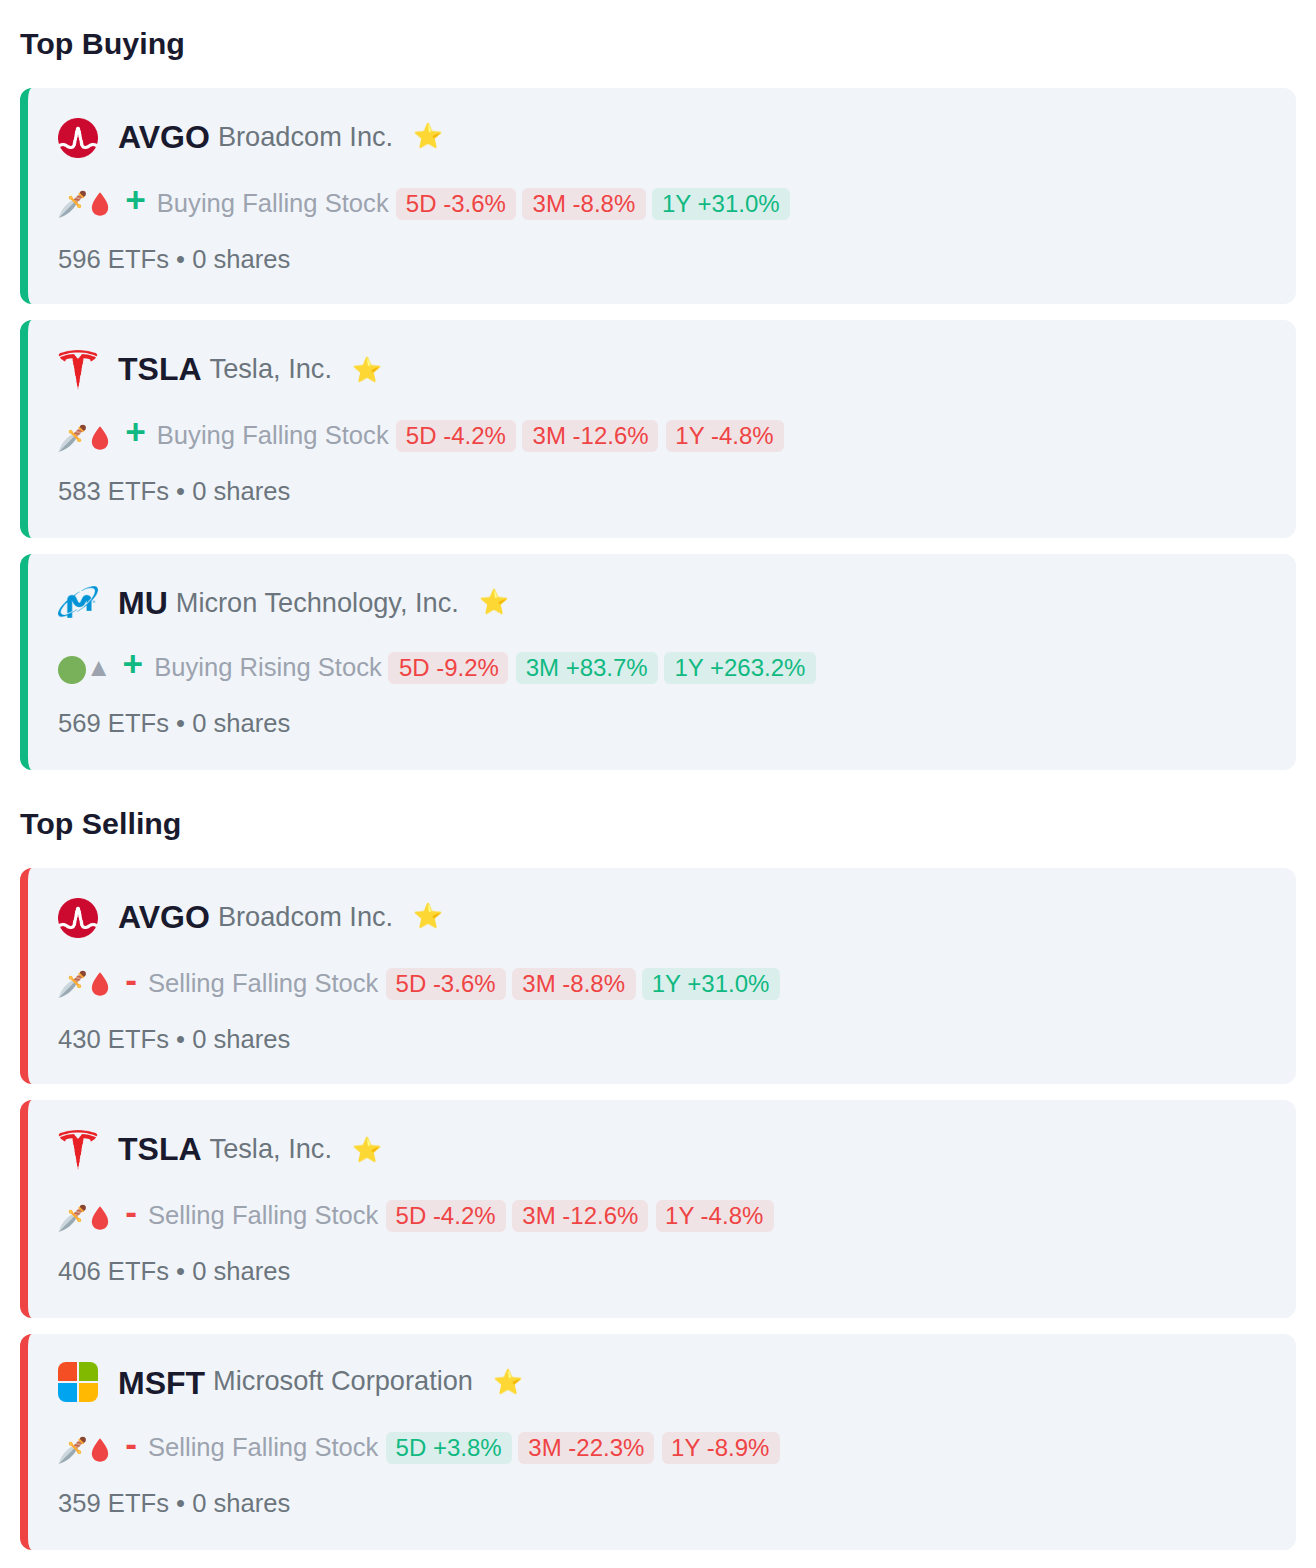
# Institutional Flow Summary Exchange-traded funds demonstrated mixed positioning in technology holdings during the latest period, with 596 ETFs adding Broadcom (AVGO) exposure while 430 reduced it, and 583 funds increasing Tesla (TSLA) positions as 406 trimmed them. The data reveals balanced institutional activity across the sector, with semiconductor exposure (Micron at 569 adds) seeing particular accumulation even as some funds simultaneously reduced positions in mega-cap software names like Microsoft.
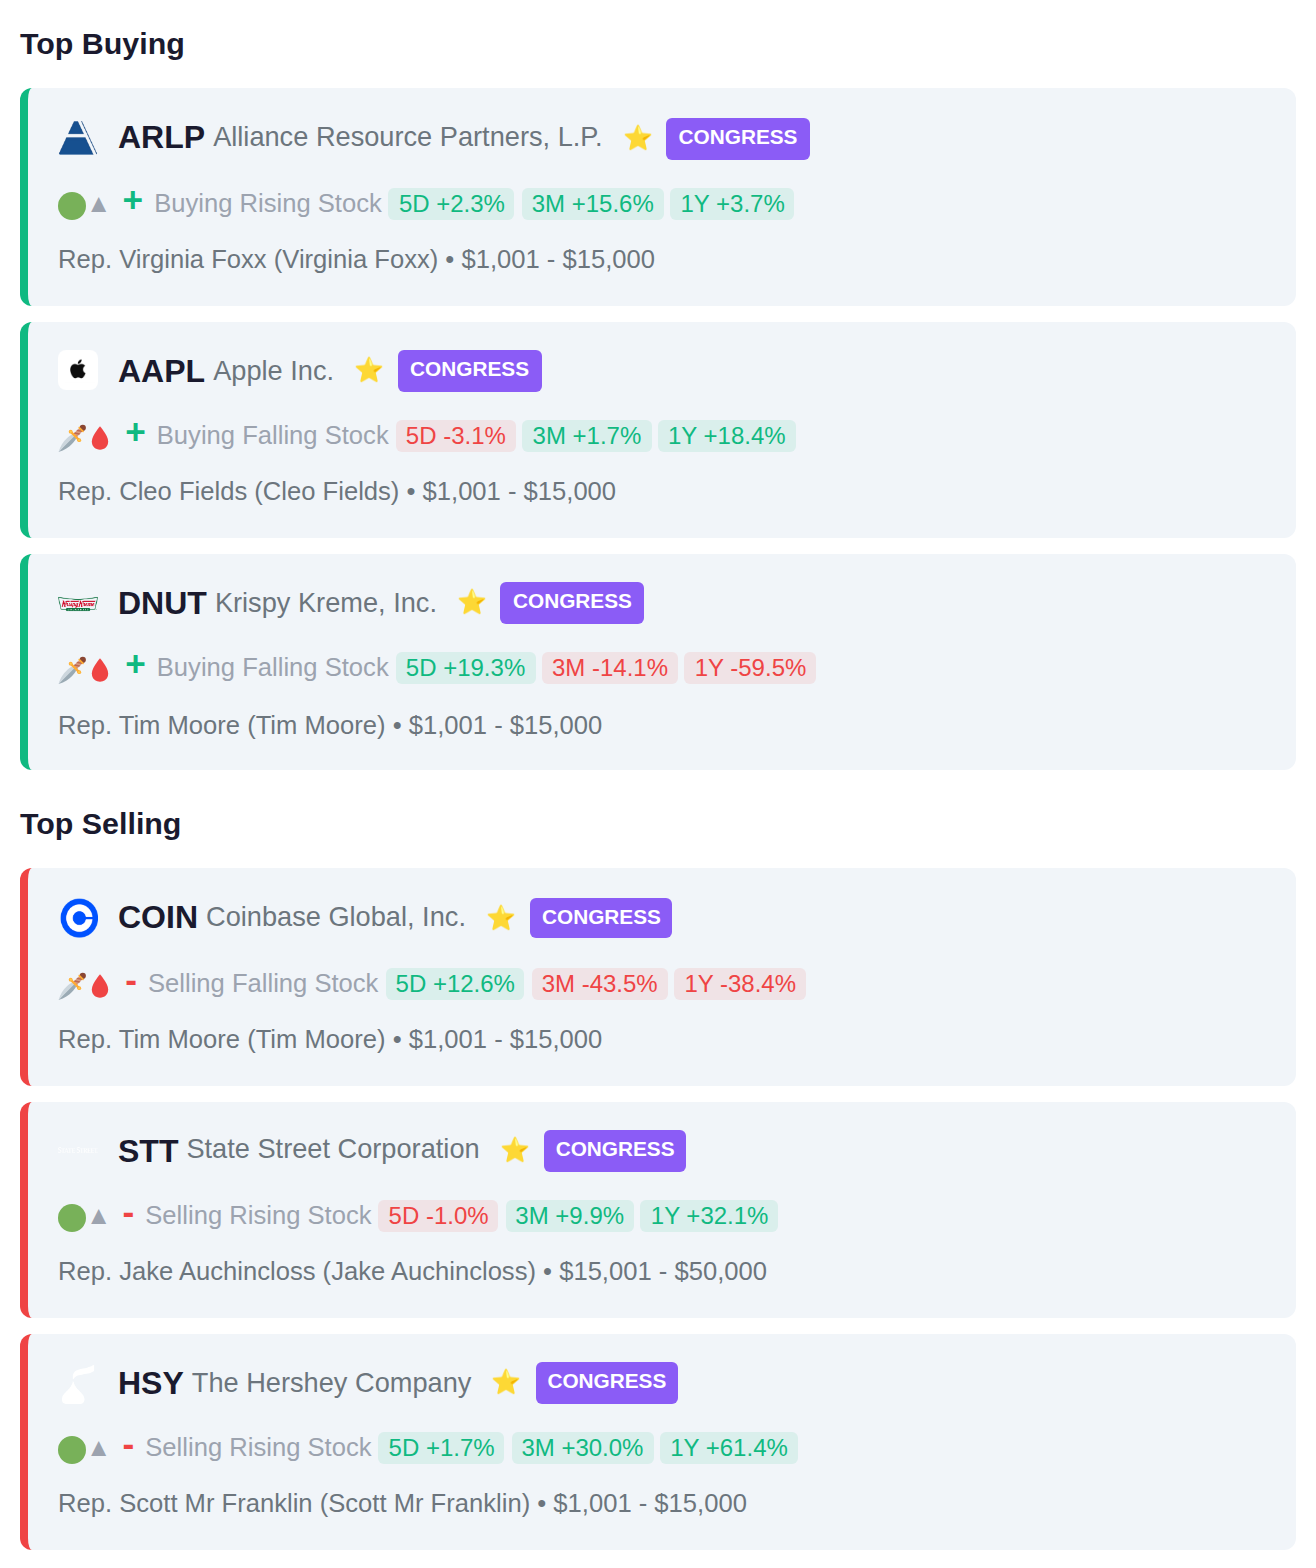
Congressional representatives made several notable transactions across energy, technology, and consumer sectors. Rep. Tim Moore purchased shares of DNUT while simultaneously reducing his position in COIN, while other members added positions in ARLP and AAPL or trimmed holdings in financial services (STT) and consumer staples (HSY).
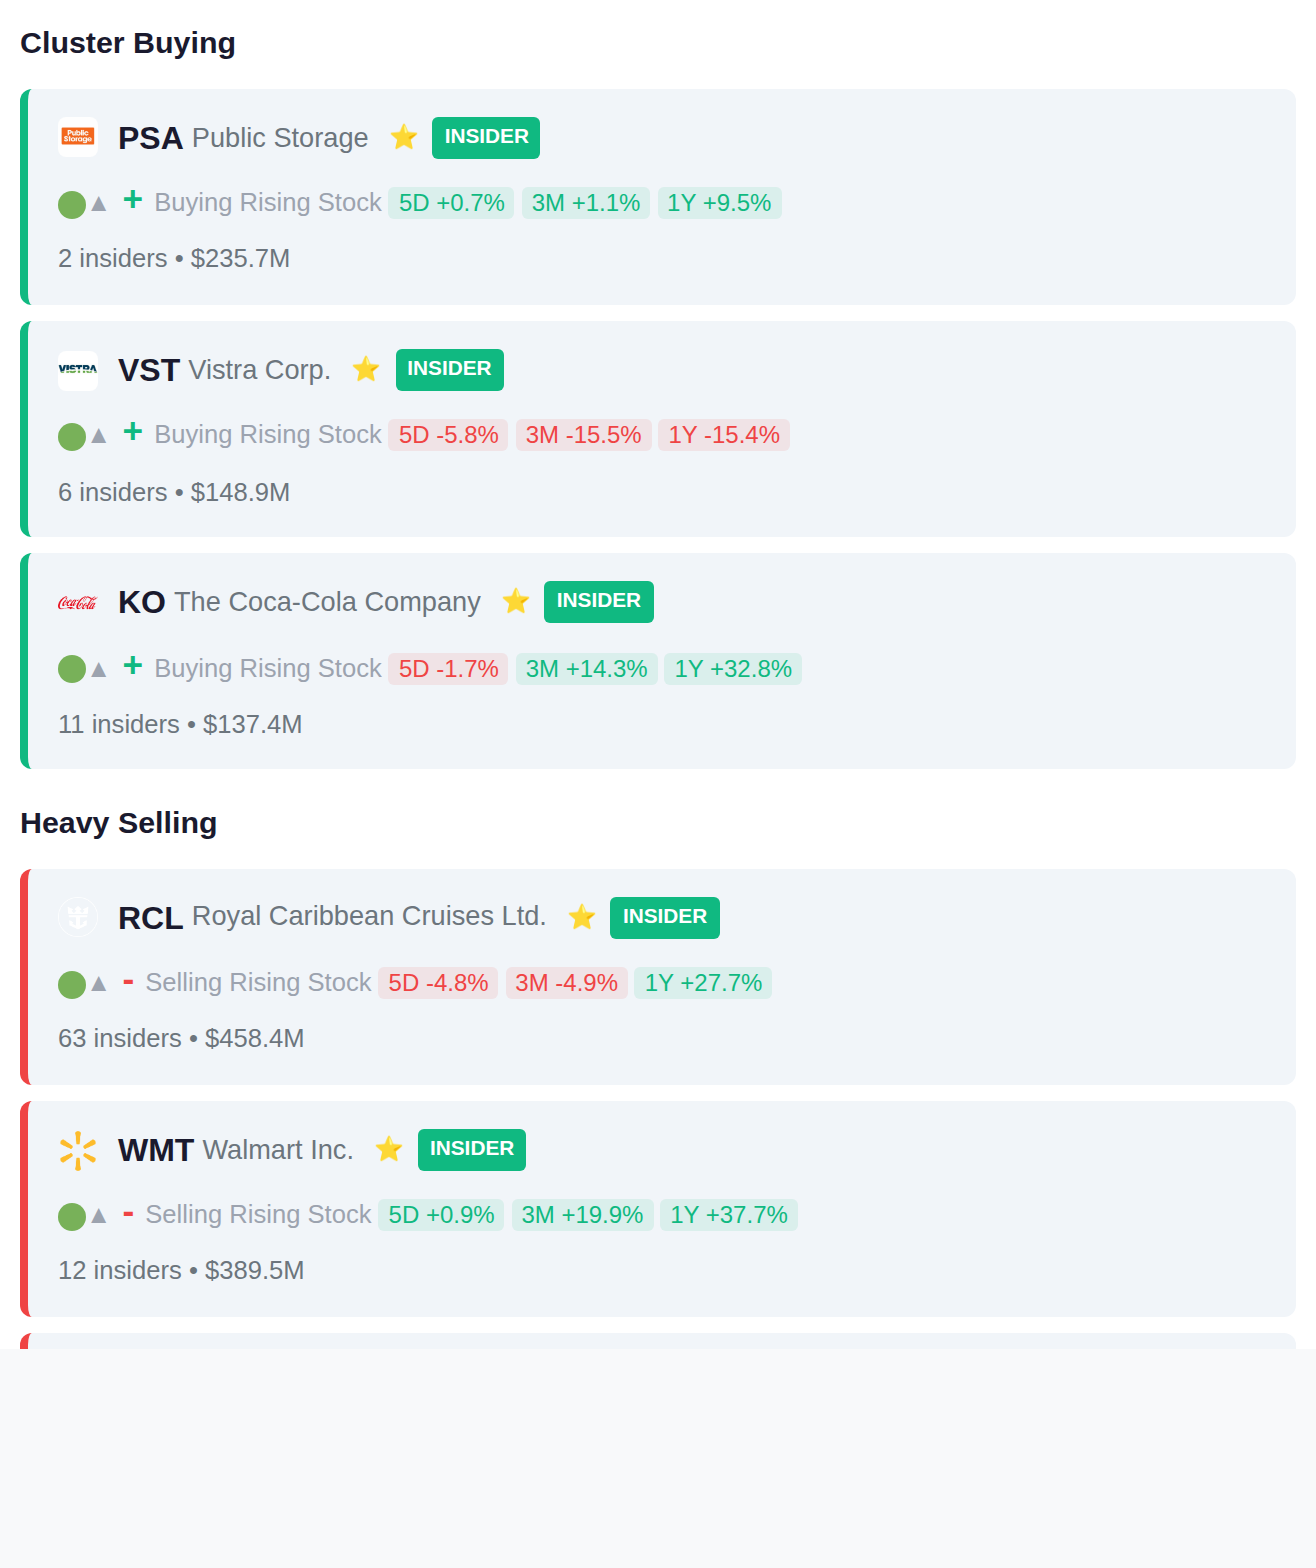
Insider activity showed balanced signals this week with 15 accumulation versus 15 distribution events, though notable clustering occurred at Coca-Cola where 11 insiders purchased shares and at Vistra where 6 insiders added positions. On the distribution side, Royal Caribbean saw the most concentrated activity with 63 insiders selling a combined $458.4 million, followed by Walmart's 12 insiders disposing of $389.5 million in shares.
Today 479 companies report earnings, with institutional accumulation patterns present in INCO.JK and ADRO.JK ahead of their releases. Distribution signals have emerged in GGAL.BA and TECO2.BA, suggesting smart money has reduced positions before their reports. Yesterday's session saw significant volatility with VTTGF surging 50.3% while DRVN dropped 34.1% and BEI.DE declined 23.9%.