The Edge
Know What They Know
🐷 PIG ROAST
💬 Word on the Street
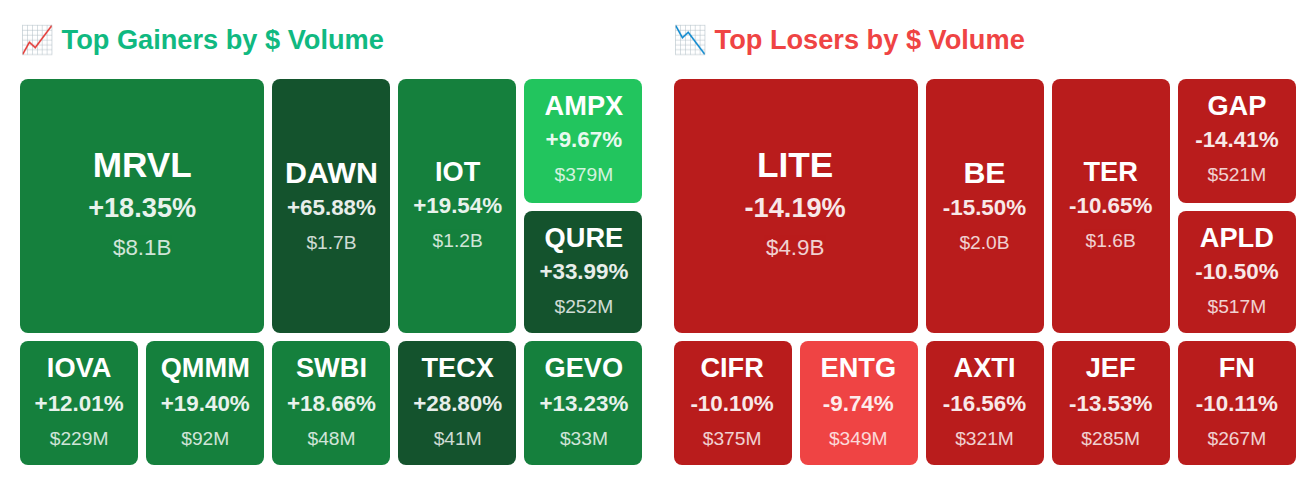
While Rep. Lloyd Doggett (D-TX) quietly added Procter & Gamble (PG) to his portfolio and the VIX exploded 27.5% to 23.8, four insiders at NRG Energy (NRG) dumped a staggering $5.3 billion in shares—part of a massive $9.3 billion net outflow from smart money today. After hours, Marvell Technology (MRVL) rocketed 18.4% to $89.57 after Wall Street's customer-loss fears proved overblown, while Day One Biopharmaceuticals (DAWN) blasted 65.9% higher on buyout speculation despite lawyers circling the deal price. Here's what smart money is doing today.
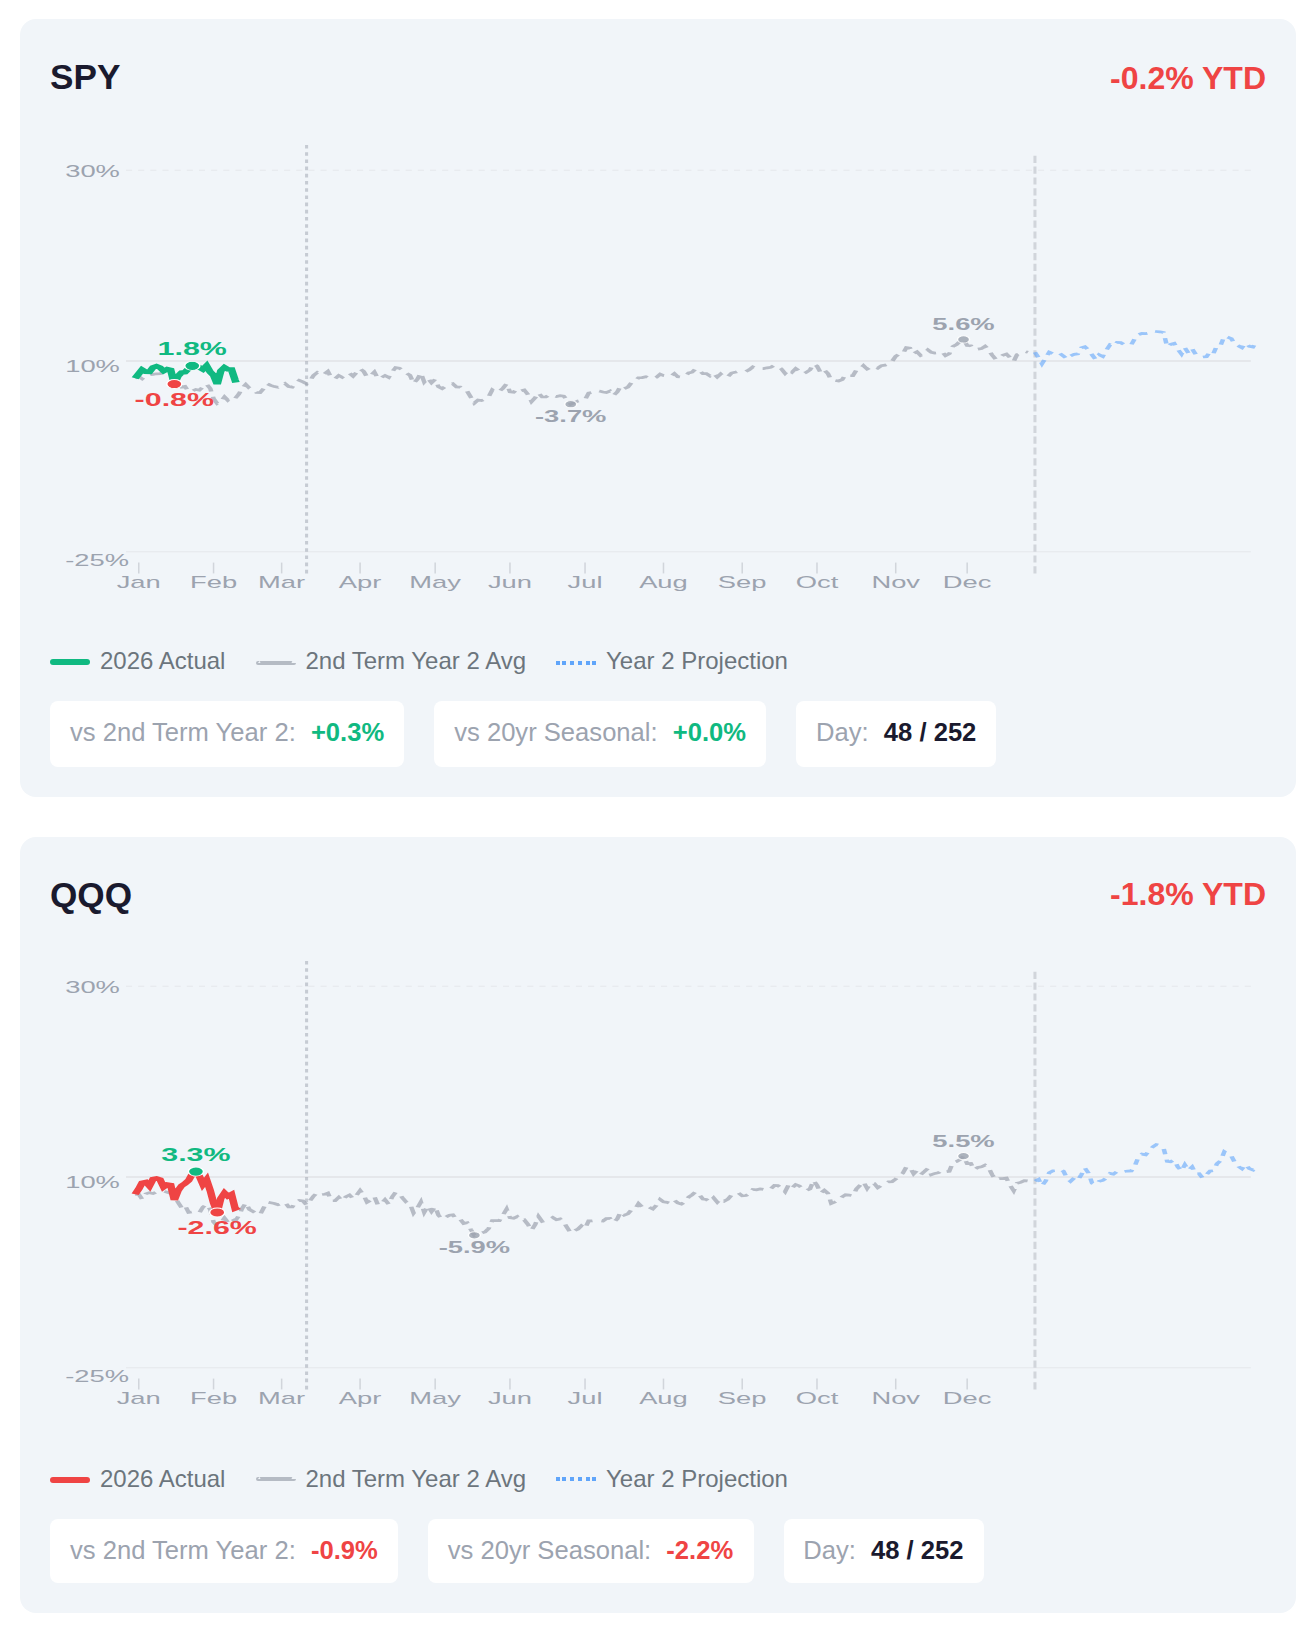
We're 48 days into Year 2 of Trump's second term, and markets are tracking remarkably close to the historical script—SPY is essentially flat at -0.2% YTD but running 30 basis points ahead of the typical second-term Year 2 pattern, while QQQ's -1.8% sits about 90 basis points below its historical comp. If the presidential cycle playbook holds, we're looking at another 1.5% potential upside through mid-March based on typical Q1 Year 2 seasonality, with the full-year historical average for second-term Year 2 sitting around 3.5% for SPY. The current positioning suggests institutions are experiencing a textbook midterm year setup so far, with large-caps performing in line with precedent while growth names lag the usual trajectory.
📚 Jargon Buster
Inverted Yield Curve
When short-term bonds pay more than long-term. Old-school recession alarm that’s been screaming since 2022. So far everyone just shrugged.
Equity market volatility surged into elevated territory this week, with the VIX climbing 27.5% to reach 23.75, indicating heightened investor concern in stock markets. In contrast, bond market volatility as measured by the MOVE index rose a more modest 12.5% to 12.82, remaining at historically subdued levels. This divergence suggests anxiety is concentrated in equities while fixed income markets continue trading with relatively calm conditions.

|| Market Sutra ||
"A reversal begins with doubt, not confidence."
— The 2016 commodity bottom began while sentiment was deeply skeptical.
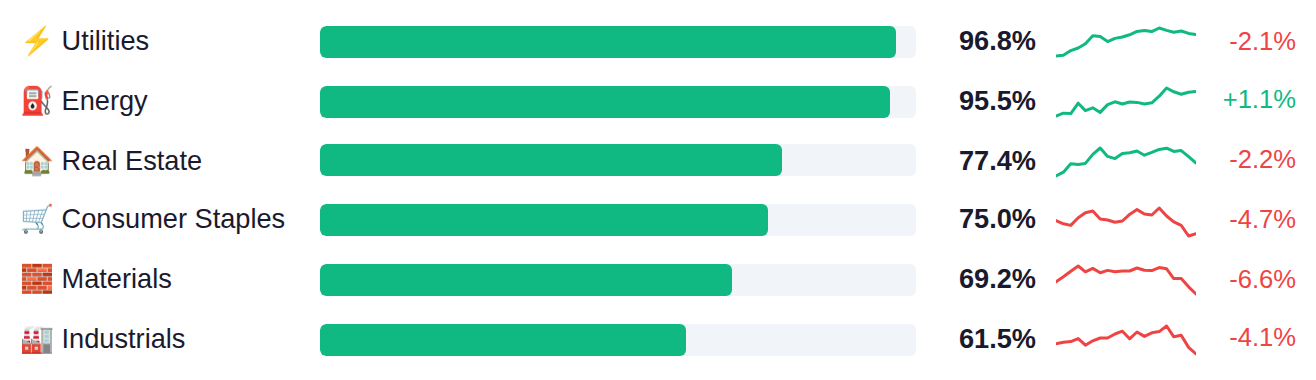
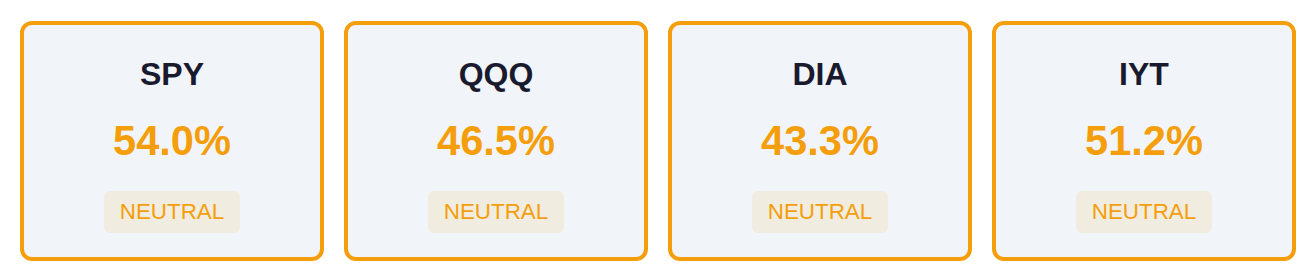
The market is exhibiting a defensive posture as traditional safety sectors dominate, with Utilities and Energy showing strength above 95% while growth-oriented Semiconductors and Technology lag significantly below 40%. Index breadth remains moderate across major benchmarks, with SPY leading at 54% while QQQ and DIA trail in the mid-40s range. This leadership pattern reflects a notable rotation away from high-growth areas into income-generating and traditionally stable sectors.
As of March 4, Fed net liquidity stood at $6.63 trillion, marking a $15.1 billion increase from the prior week—this expansion in liquidity typically correlates with more accommodative conditions for risk assets as additional dollars chase existing investments. The next H.4.1 Federal Reserve balance sheet release is scheduled for Thursday, March 12, which will show whether this liquidity injection continues or reverses.
Yesterday's February jobs report delivered a shocking -92K payrolls print against expectations of +70K growth, marking the first negative reading since December 2020 and the worst miss by 162K since the pandemic era, though the picture was complicated by stronger-than-expected wage growth with hourly earnings up 3.8% year-over-year versus the 3.6% estimate. The unemployment rate ticked up to 4.4% from 4.3%, while January retail sales provided a bright spot with a 0.3% gain against forecasts for a -0.3% decline, suggesting consumer resilience despite labor market softness. Traders will be watching tomorrow's existing home sales data for February, estimated at 3.88M, to gauge whether housing is stabilizing after January's sharp -8.4% monthly decline, as the combination of weak payrolls and persistent wage pressures keeps the Fed in a difficult position between growth concerns and inflation risks.
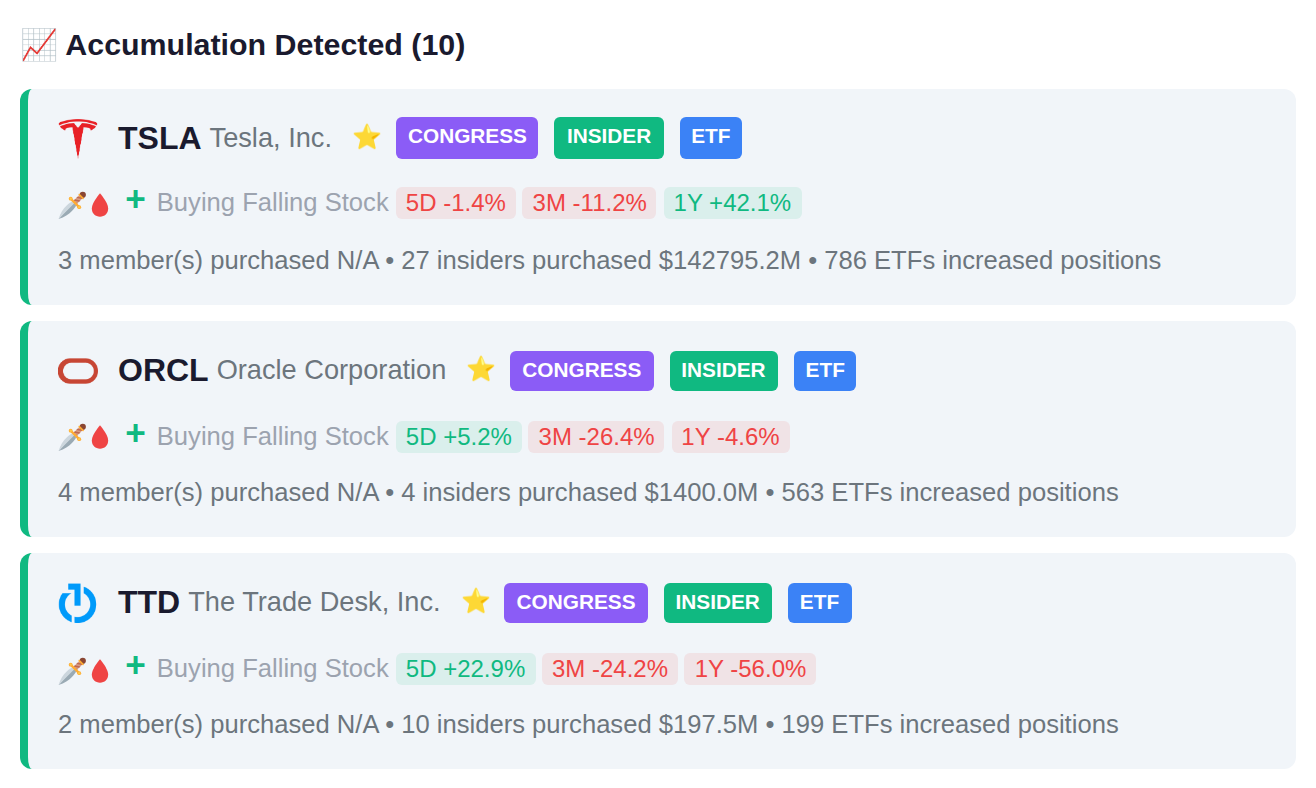
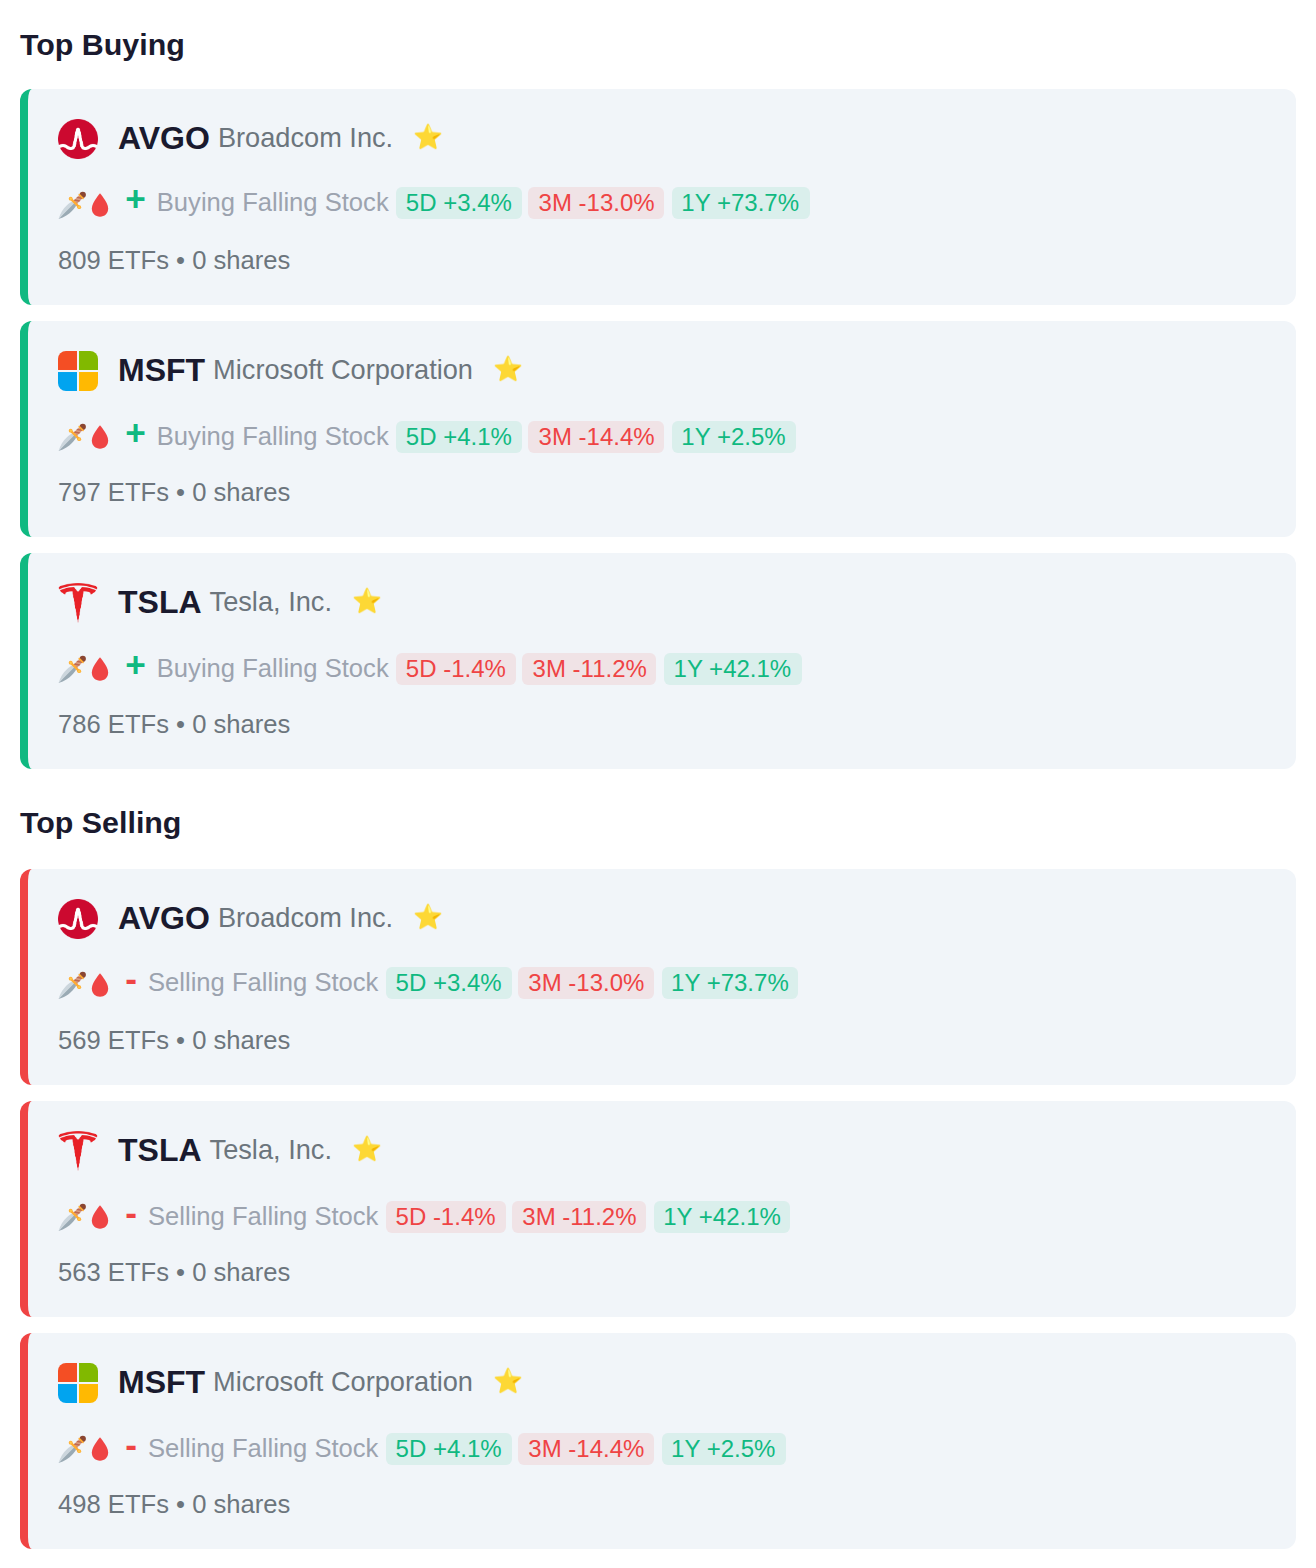
# Institutional Flow Summary Exchange-traded funds displayed divided positioning in mega-cap technology during the period, with 809 ETFs adding Broadcom exposure while 569 reduced it, 797 adding Microsoft against 498 removing it, and 786 adding Tesla positions while 563 trimmed them. The balanced 10-to-10 split between additions and removals across semiconductor, software infrastructure, and electric vehicle manufacturers suggests institutional repositioning within technology rather than a clear sector rotation.
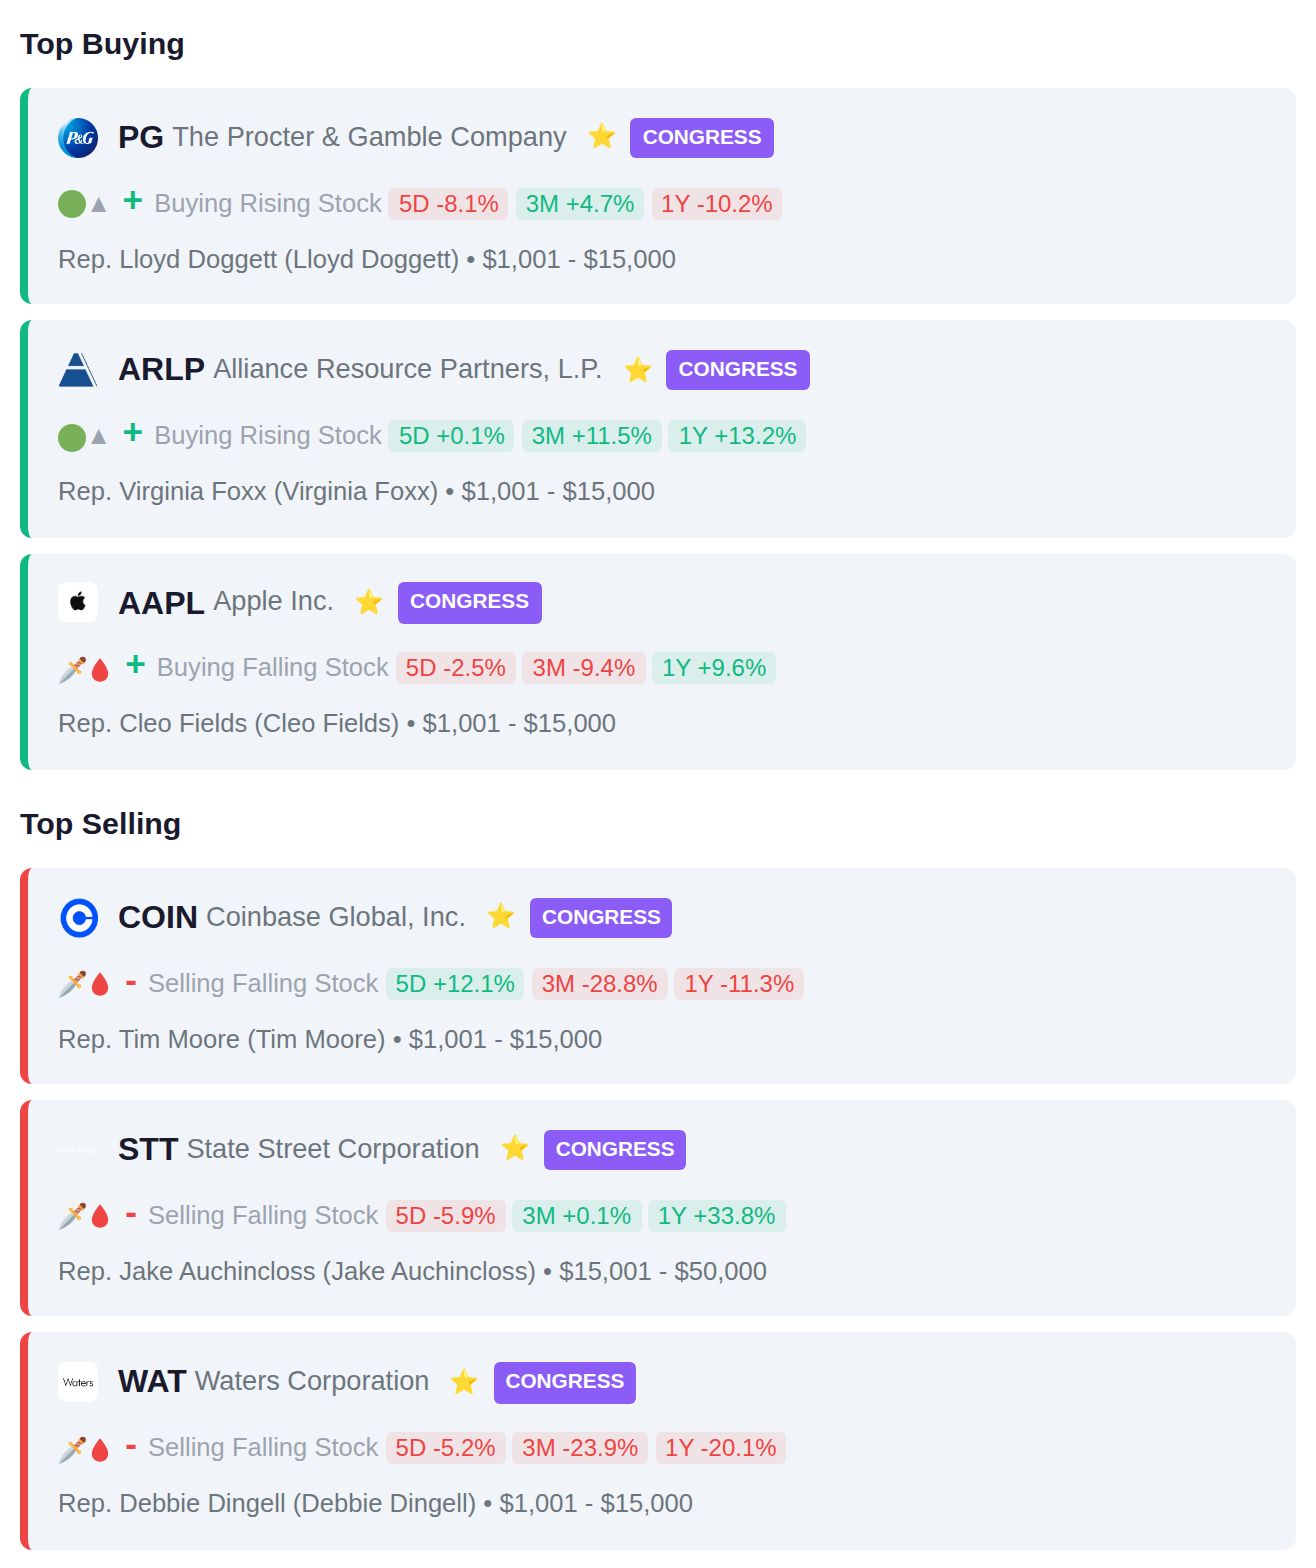
Congressional trading activity this week showed Representatives Lloyd Doggett, Virginia Foxx, and Cleo Fields purchasing positions in PG, ARLP, and AAPL respectively, while Representatives Tim Moore, Jake Auchincloss, and Debbie Dingell disclosed sales of COIN, STT, and WAT. The transactions span consumer staples, energy infrastructure, technology, cryptocurrency-related equities, and financial services sectors with no clear directional pattern emerging from the reported trades.
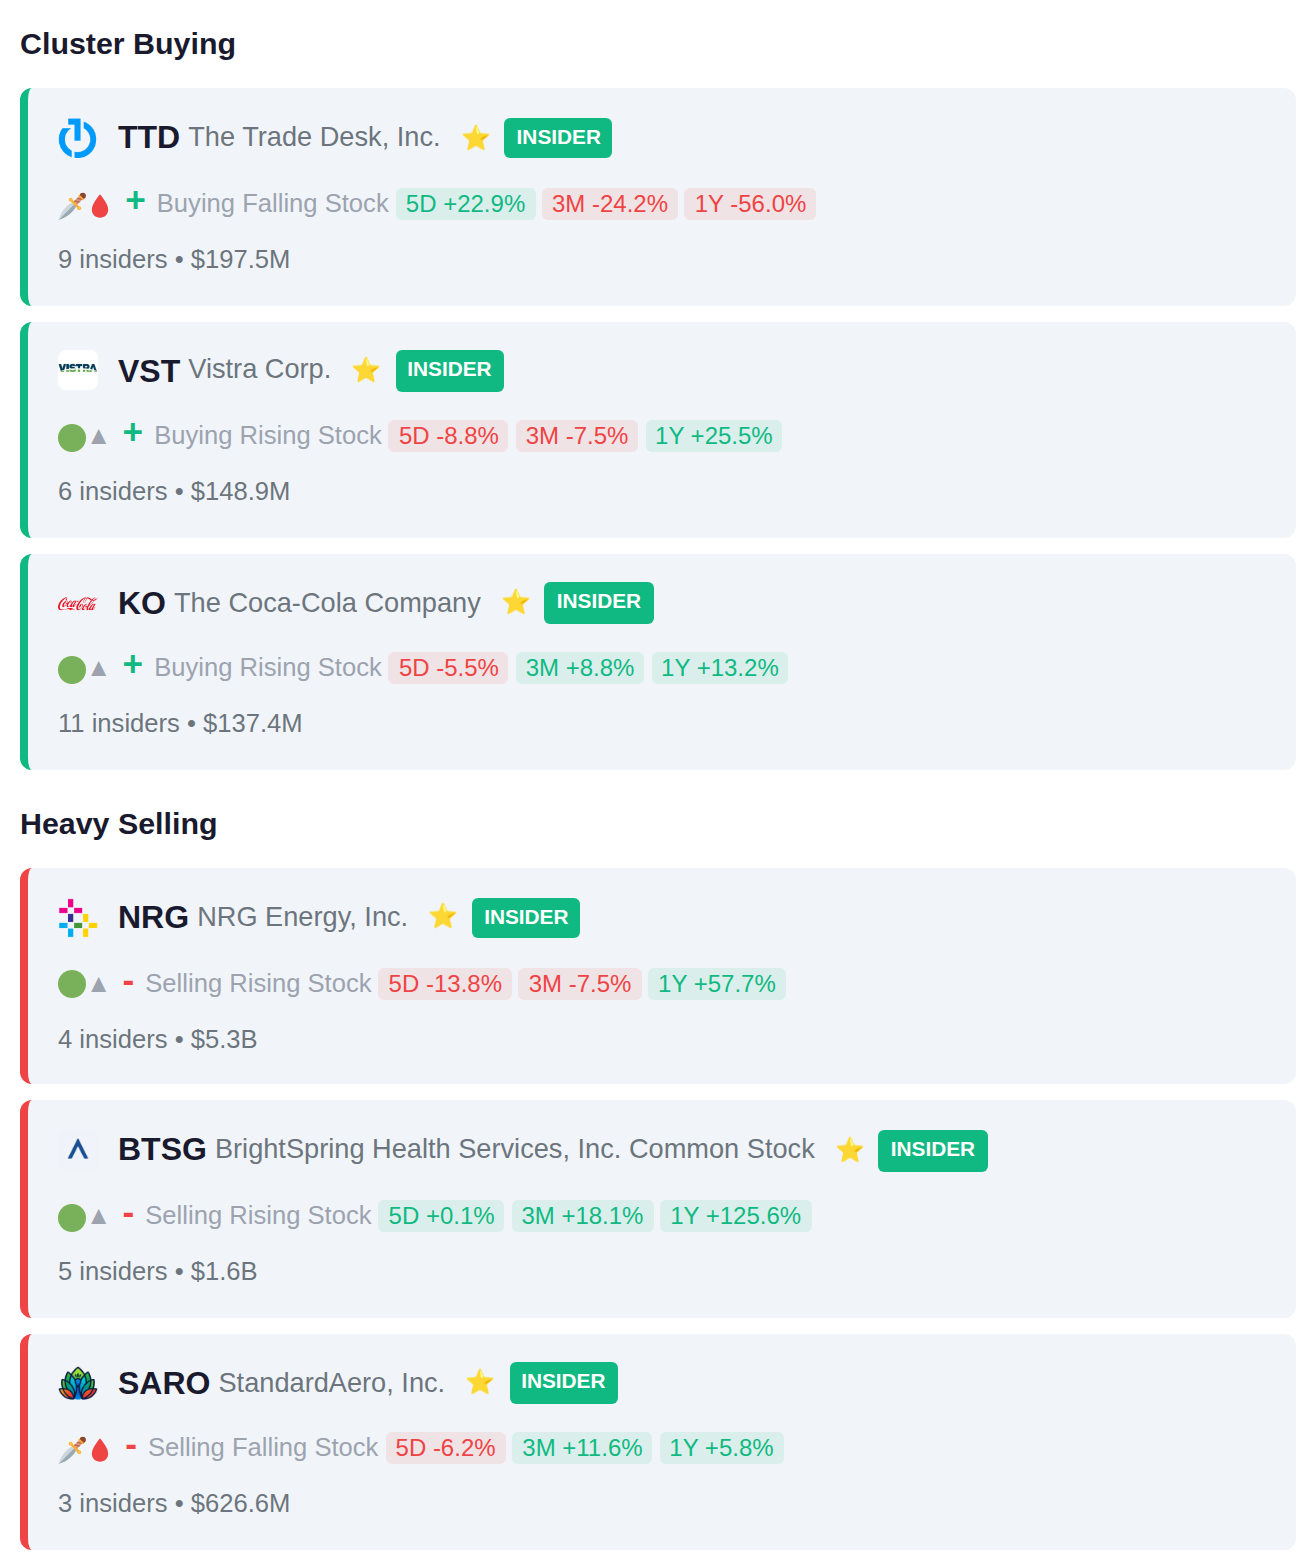
Notable cluster activity this week shows 11 insiders at KO made purchases or received awards, while 9 insiders at TTD and 6 at VST also accumulated positions. On the distribution side, 4 insiders at NRG sold a combined $5.3 billion in shares, 5 insiders at BTSG offloaded $1.6 billion, and 3 insiders at SARO reduced positions totaling $626.6 million.
Yesterday's session saw significant moves with 6456.TW surging 31.3% and 3665.TW climbing 25.5%, while 2171.HK declined 23.1%. Today's earnings calendar includes 394 companies, with accumulation signals appearing in ADMR.JK and ADRO.JK ahead of their reports, while distribution signals have emerged in ARTO.JK and AGRO.JK. Tomorrow's slate narrows to 281 companies reporting results.