The Edge
Know What They Know
🐷 PIG ROAST
💬 Word on the Street
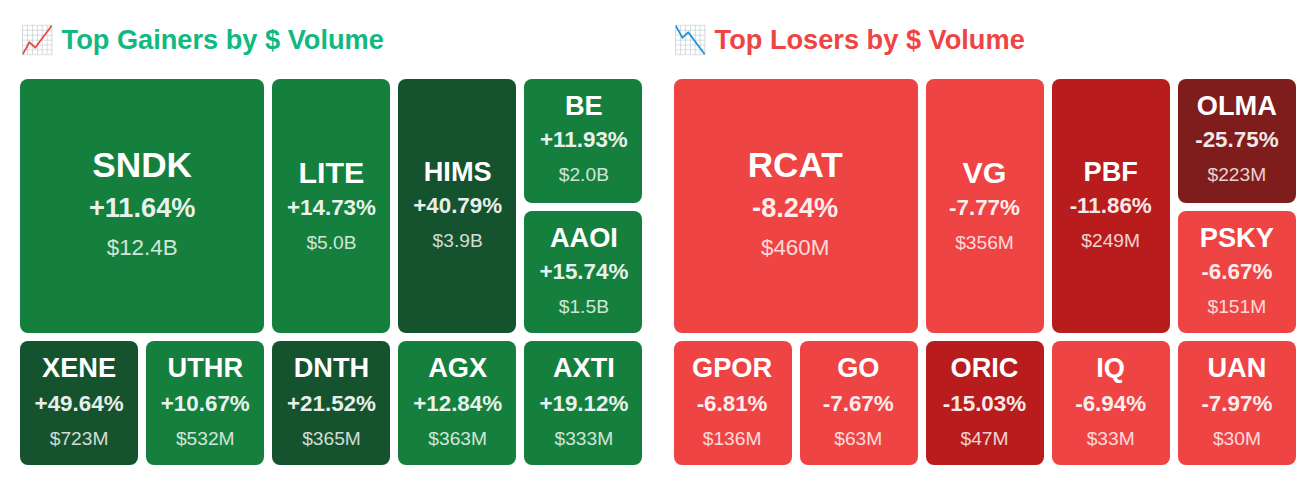
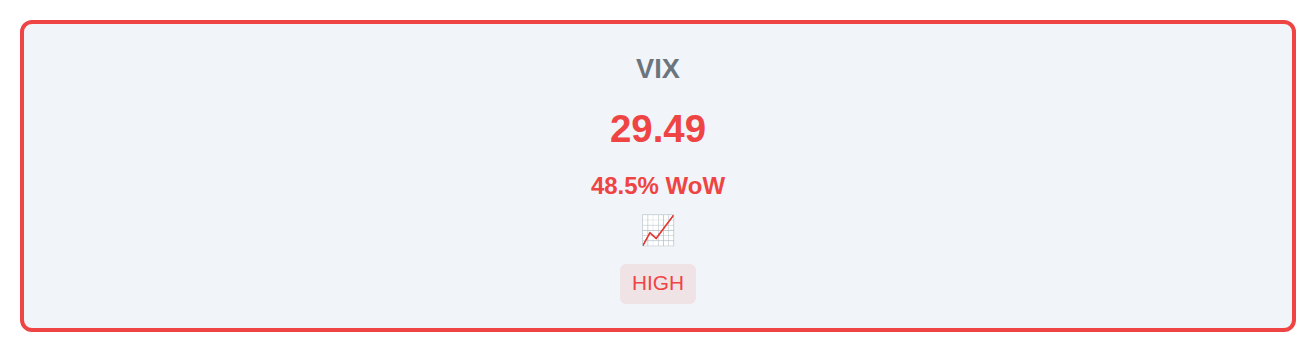
While Rep. David Taylor quietly added Broadcom (AVGO) and the VIX screamed up 48.5% to 29.5, four insiders at NRG Energy (NRG) dumped a staggering $5.3 billion in stock—the kind of exit that makes you wonder what they know that we don't. Meanwhile, institutions like BlackRock gorged on Vertiv Holdings (VRT) as it rocketed 9.3% after hours, and Hims & Hers Health (HIMS) exploded 40.8% on a Novo Nordisk deal, though it's still down 34% for the year. Here's what smart money did with $9.2 billion in net outflows today.
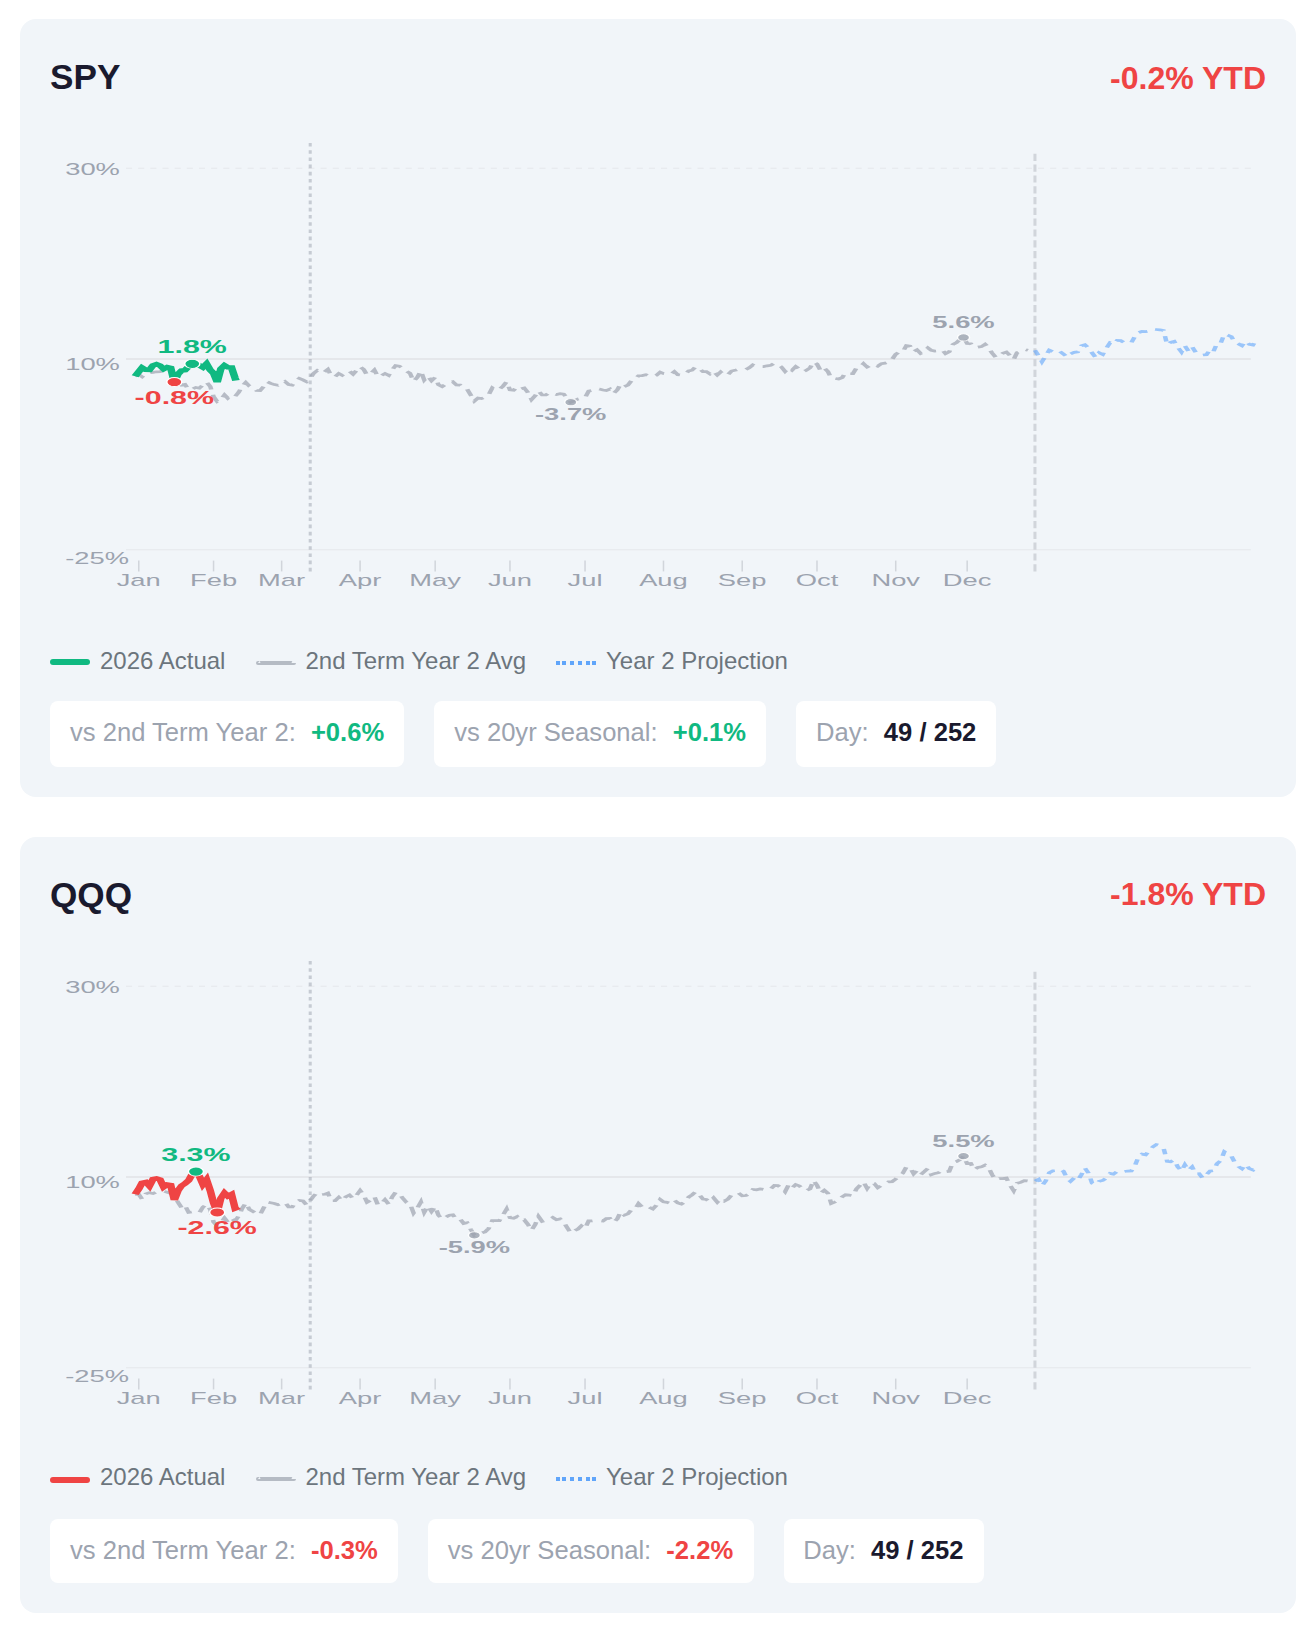
We're 49 trading days into Year 2 of Trump's second term, and while SPY sits slightly negative at -0.2% YTD, it's actually tracking 0.6% ahead of the typical second-term Year 2 pattern at this point in the calendar. History shows Year 2 of second terms has averaged around 3.5% for the full year, with the next stretch into mid-March typically adding another 1.5% based on seasonal data—though QQQ's -1.8% YTD performance is running a bit cooler than its historical benchmark. The current positioning suggests markets are following the playbook reasonably well despite the modest YTD drawdown, with the meat of Year 2's typical gains historically materializing in the back half of the year rather than these opening weeks.
📚 Jargon Buster
Real Yield
Treasury yield minus inflation. If it’s negative, you’re literally paying the government to hold your money. Congrats.
Equity market volatility surged into high-fear territory this week, with the VIX climbing 48.5% to 29.49, indicating significant concern among options traders about near-term stock price swings. In contrast, bond market volatility remains subdued, as the MOVE index edged up only 3.5% to 13.40, suggesting fixed income investors are pricing in relatively stable Treasury price action. This divergence between equity and bond volatility measures reflects differing risk perceptions across asset classes, with stock market participants demanding substantially higher premiums for downside protection while bond traders remain relatively calm.
|| Market Sutra ||
"A system must survive the trader running it."
— Many quant funds failed because human override ruined the model.
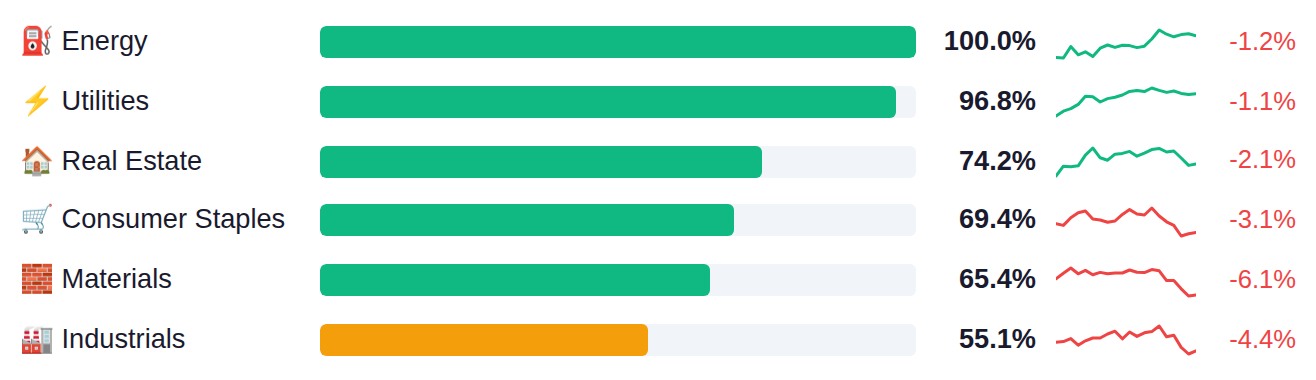
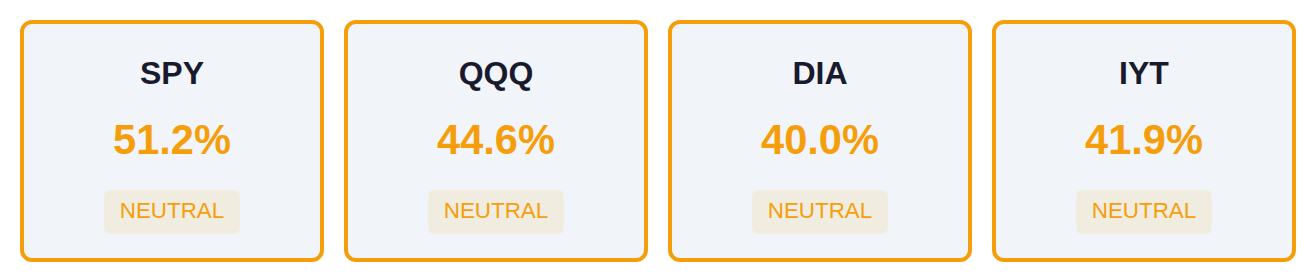
Market breadth remains narrow with the S&P 500 showing only 51% of components participating in the current move, while the Dow and Nasdaq demonstrate even weaker internal participation at 40% and 45% respectively. The market exhibits a clear defensive rotation with Energy, Utilities, and Real Estate sectors leading at 100%, 97%, and 74% participation, while growth-oriented sectors including Technology, Financials, and Consumer Discretionary lag significantly at approximately 29-31% participation. This divergence between strong defensive sector performance and weak participation in cyclical and growth sectors, combined with deteriorating index breadth across major benchmarks, signals reduced market conviction beneath headline index levels.
As of March 4, Fed net liquidity stands at $6.63 trillion, up $15.1 billion week-over-week, indicating a modest increase in system-wide dollar availability that historically correlates with supportive conditions for risk assets. The next H.4.1 Federal Reserve balance sheet update releases Thursday, March 12, which will show whether this liquidity expansion continues or reverses.
Yesterday's data was relatively light, leaving markets to digest the recent economic surprise index pullback to +1.7 from +1.9 the prior week, reflecting a marginal cooling in data beats relative to expectations. Today's existing home sales are estimated to show a more modest 0.8% monthly decline versus February's sharp 8.4% drop, with the absolute level expected at 3.88M—still near multi-year lows as elevated mortgage rates continue to constrain housing turnover. Tomorrow's February CPI release takes center stage, with headline inflation expected to tick up to 0.3% month-over-month from 0.2% while core inflation is forecast to moderate to 0.2% from 0.3%, a combination that would keep year-over-year rates steady at 2.4% headline and 2.5% core—critical readings as markets assess whether the Fed's easing cycle remains on track amid persistent price pressures that have stalled meaningful progress toward the 2% target since mid-2024.
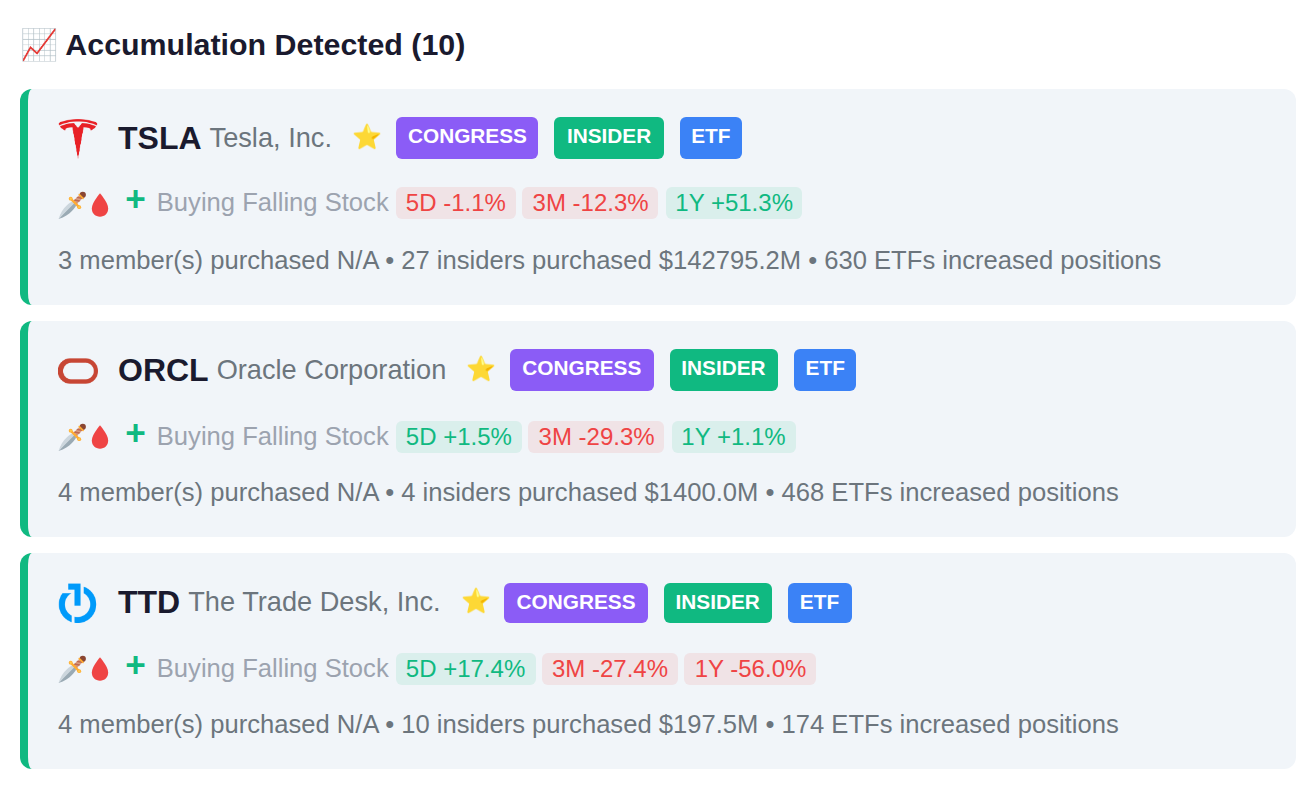
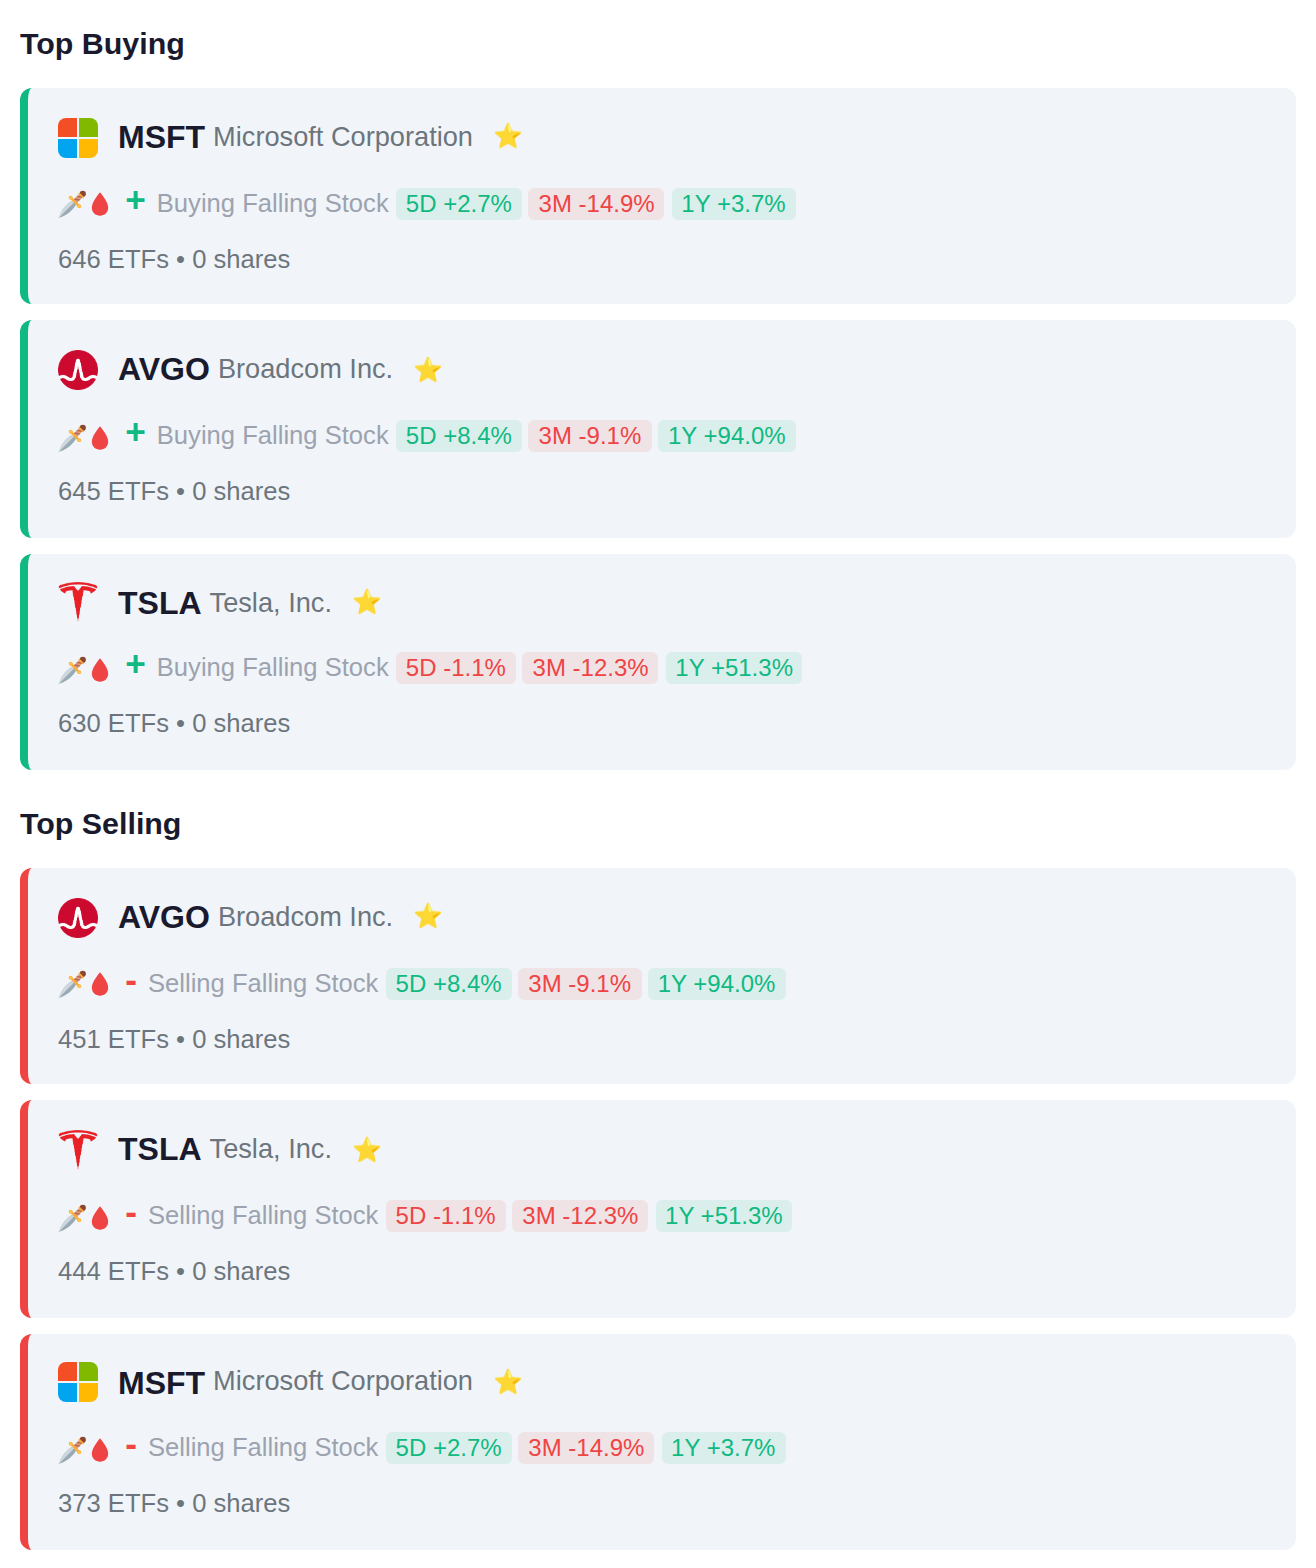
Institutional flows this period showed a near-even split with 10 ETFs adding positions and 10 reducing them, though activity centered heavily on mega-cap technology names—MSFT attracted 646 ETF additions while AVGO and TSLA each drew over 630, even as hundreds of funds simultaneously trimmed these same positions. The data suggests ongoing portfolio rebalancing within the technology sector rather than directional conviction, with institutions both adding and paring exposure to the same semiconductor and electric vehicle stocks.
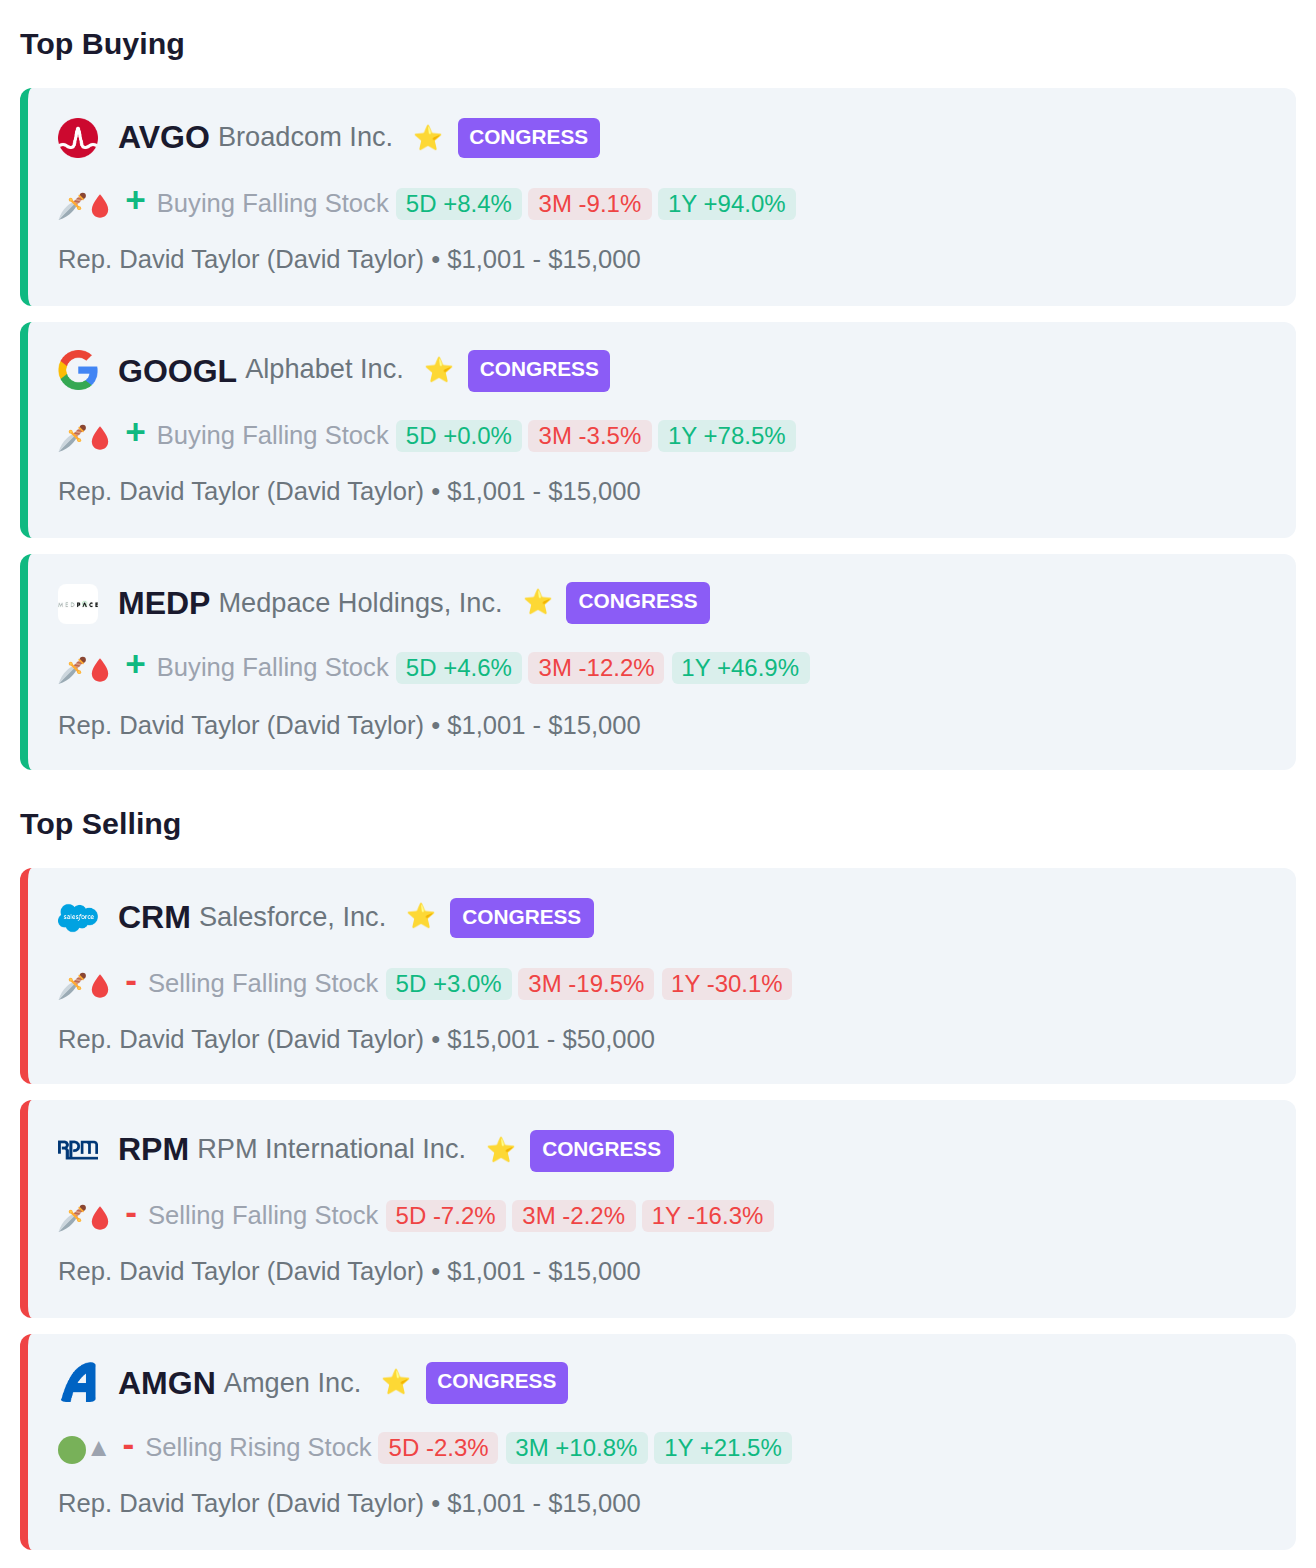
Rep. David Taylor executed a portfolio rotation, purchasing shares of AVGO, GOOGL, and MEDP while selling positions in CRM, RPM, and AMGN. The transactions show a shift toward semiconductor and technology exposure (Broadcom, Google) and medical devices (Medpile) while exiting cloud software, specialty chemicals, and biotechnology holdings.
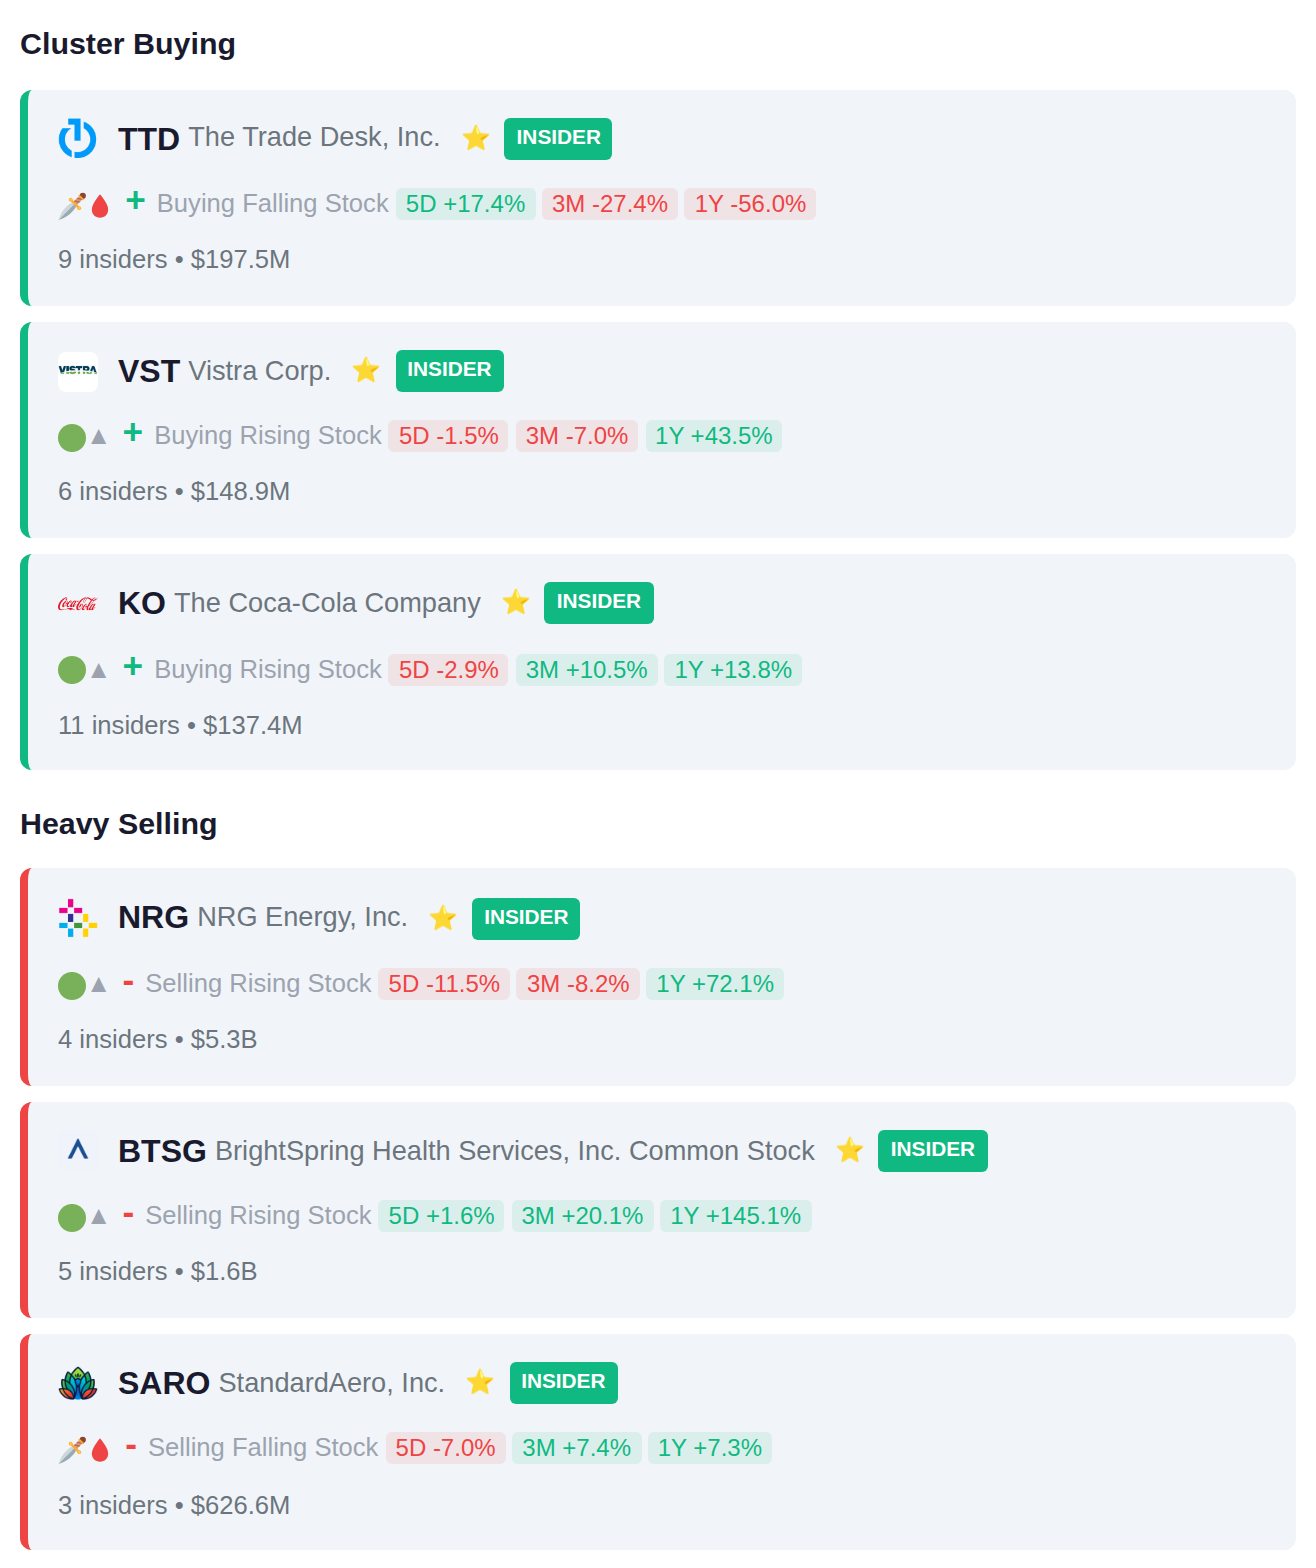
Notable cluster activity shows 11 insiders accumulated positions in KO, while 9 insiders added to TTD and 6 to VST during the reporting period. On the distribution side, 4 insiders at NRG sold $5.3 billion in combined holdings, 5 insiders at BTSG offloaded $1.6 billion, and 3 insiders at SARO reduced positions totaling $626.6 million.
Today's earnings calendar features 436 companies reporting results, with institutional activity showing accumulation patterns in 2222.SR and ITX.WA ahead of their reports, while smart money has reduced positions in GOTO.JK and GGAL.BA prior to their earnings releases. Yesterday's session saw significant downward moves in 0ROQ.L, COTN.SW, and 0RGI.L, declining 22.7%, 22.4%, and 17.4% respectively. Tomorrow's schedule includes 284 additional companies set to report quarterly results.