The Edge
Know What They Know
🐷 PIG ROAST
💬 Word on the Street
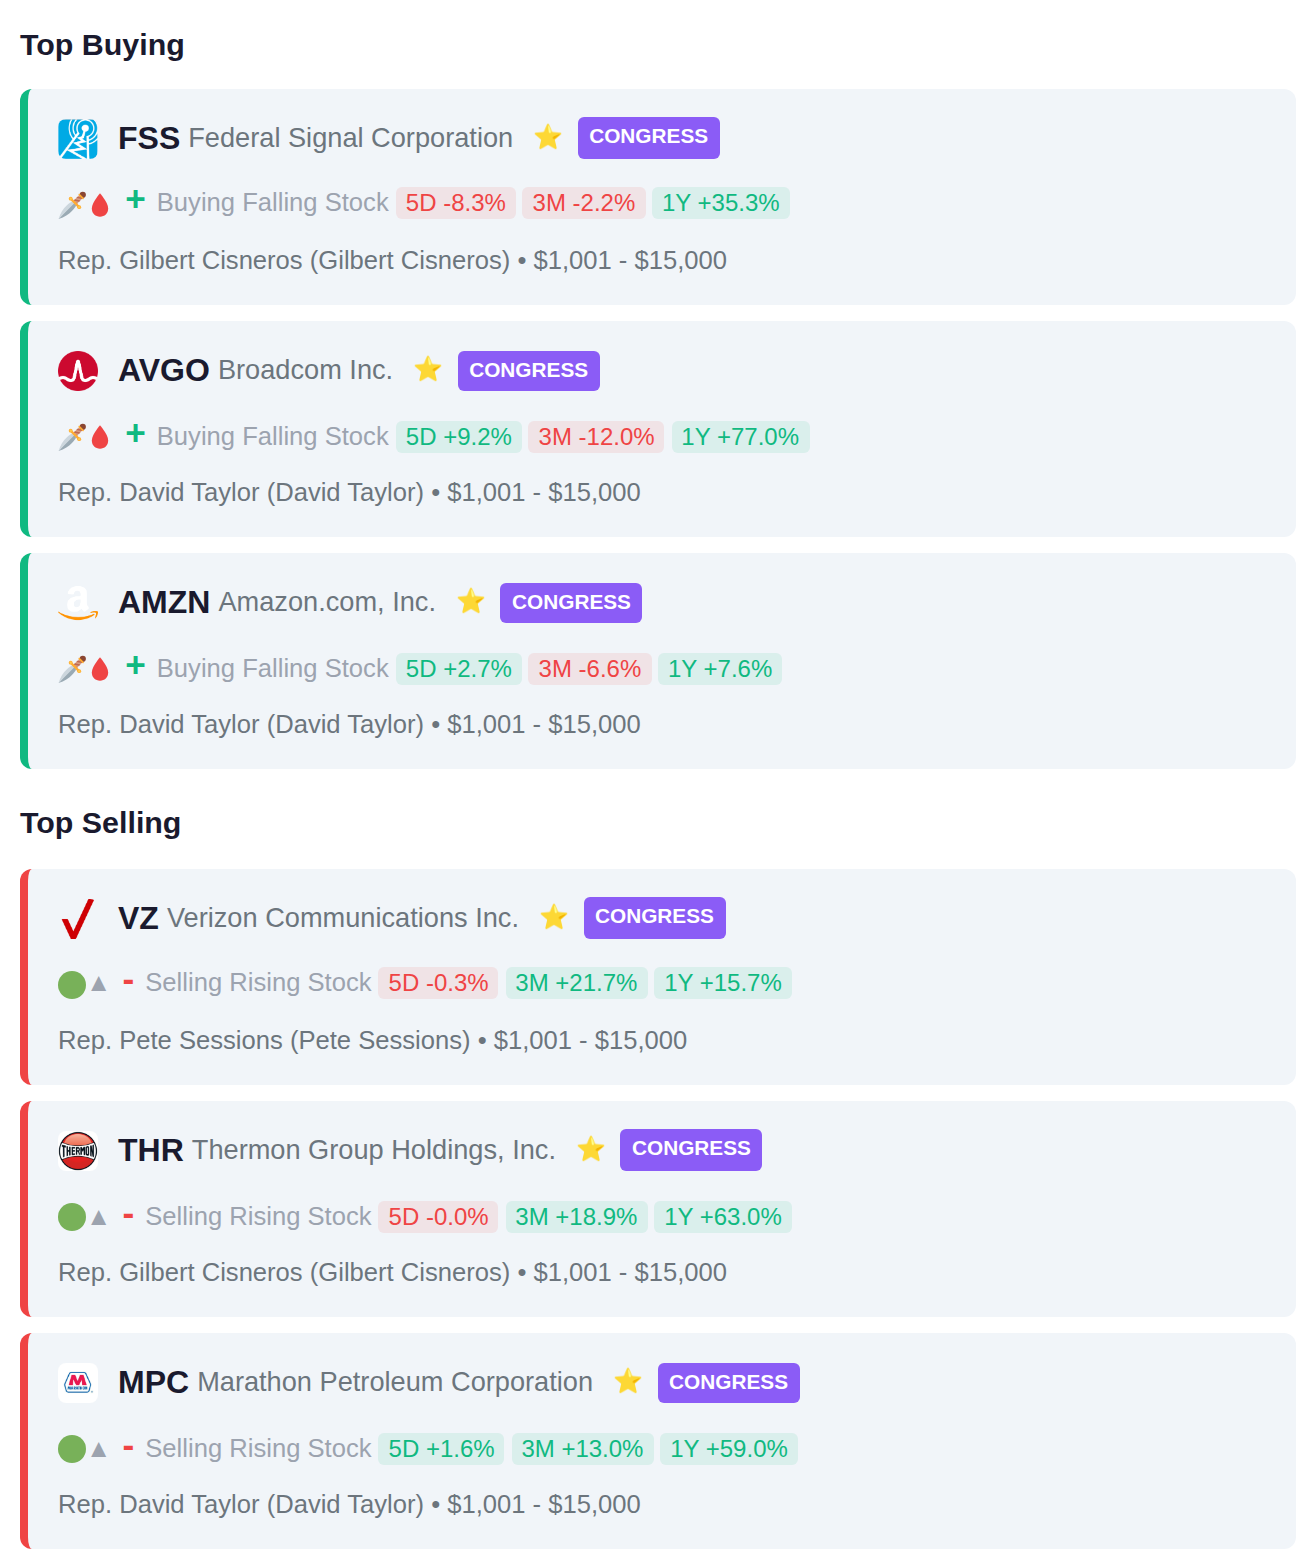
While Vertex Pharmaceuticals (VRTX) vaulted 8.3% after-hours to $499 on kidney trial data that crushed proteinuria by 52%, NRG Energy insiders were quietly dumping $5.3 billion in stock—the kind of mass exodus that makes you wonder what the C-suite sees that we don't. Meanwhile, Rep. Gilbert Cisneros (D-CA) picked up shares of Federal Signal Corporation (FSS) worth up to $15,000 as the VIX spiked 18.9% to 25.5 and smart money recorded a $9.6 billion net outflow across the market. Here's what the insiders, institutions, and Capitol Hill are actually doing with their money today.
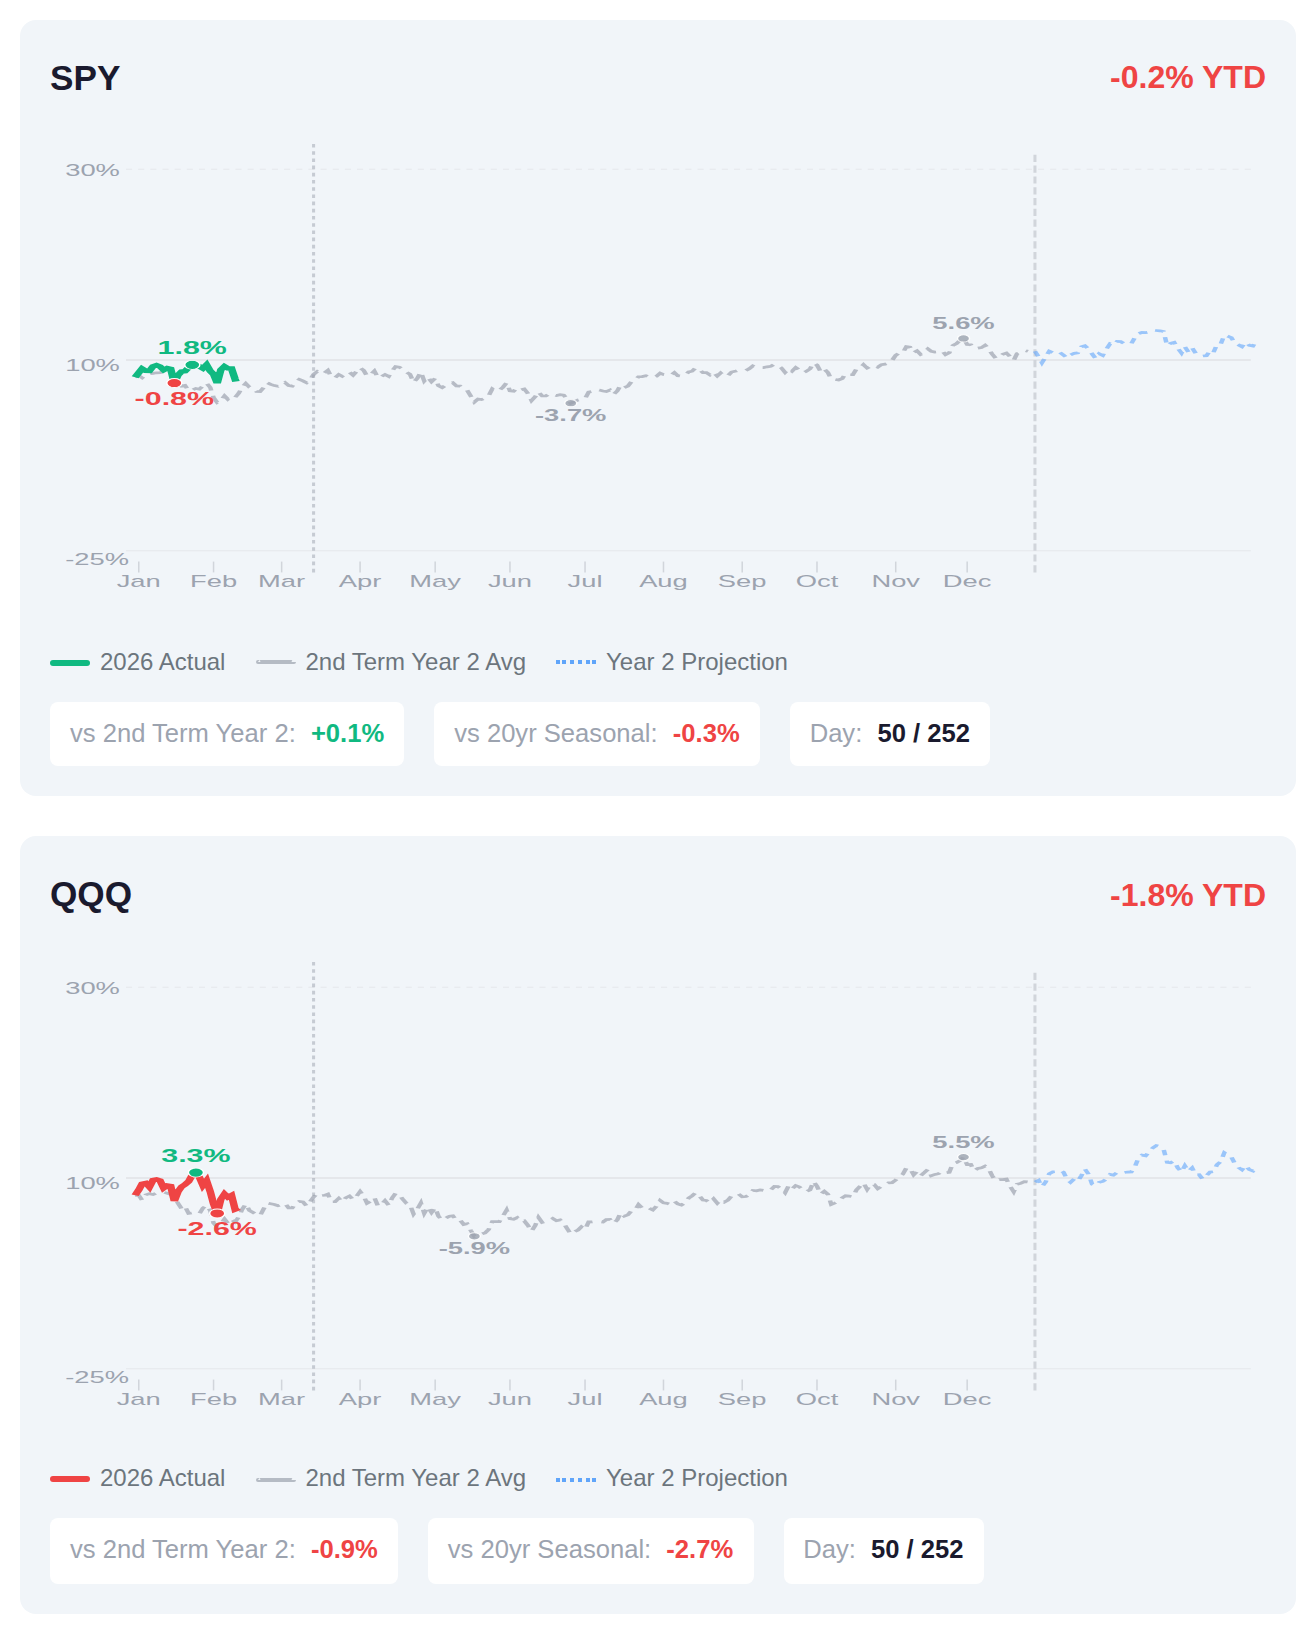
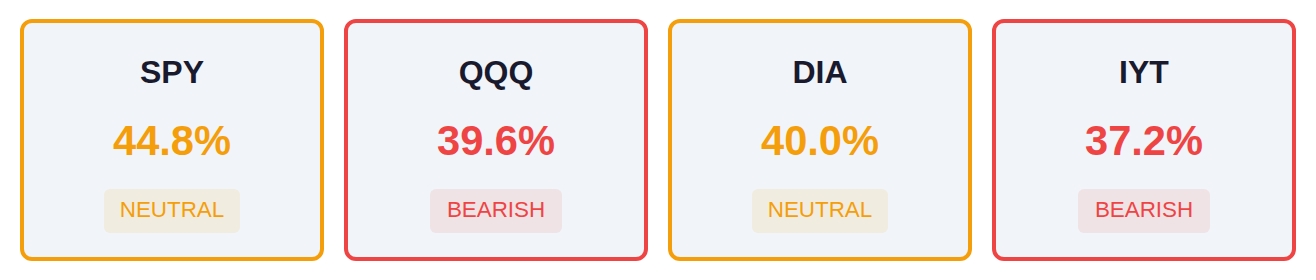
We're 50 trading days into Year 2 of Trump's second term, and the major indexes are running slightly cooler than the historical playbook—SPY sits roughly flat while tracking just 0.1% ahead of the typical second-term Year 2 pattern, though QQQ is lagging nearly a percentage point behind its historical counterpart. The backdrop here matters: second-term Year 2s have historically delivered around 3.5% gains for the full year, with another 1.5% typically materializing by mid-March as Q1 closes out. Right now we're essentially tracking in line with that historical rhythm, neither significantly ahead nor behind the typical trajectory that institutional desks watch when they're mapping positioning through the presidential cycle.
📚 Jargon Buster
TIPS
Treasury bonds that grow when inflation gets spicy. Your principal literally inflates like your grocery bill.
The VIX surged 18.9% this week to reach 25.50, crossing into high fear territory as equity market participants priced in elevated uncertainty. This equity volatility spike contrasts sharply with the MOVE index at 14.47, which remains subdued and indicates bond markets are experiencing relatively calm conditions despite the 5.3% weekly increase. The divergence between equity and fixed income volatility suggests fear is currently concentrated in stock markets rather than reflecting broader systemic concerns across asset classes.

|| Market Sutra ||
"In the long run, discipline outperforms brilliance."
— Simple trend-following models beat most active managers globally.
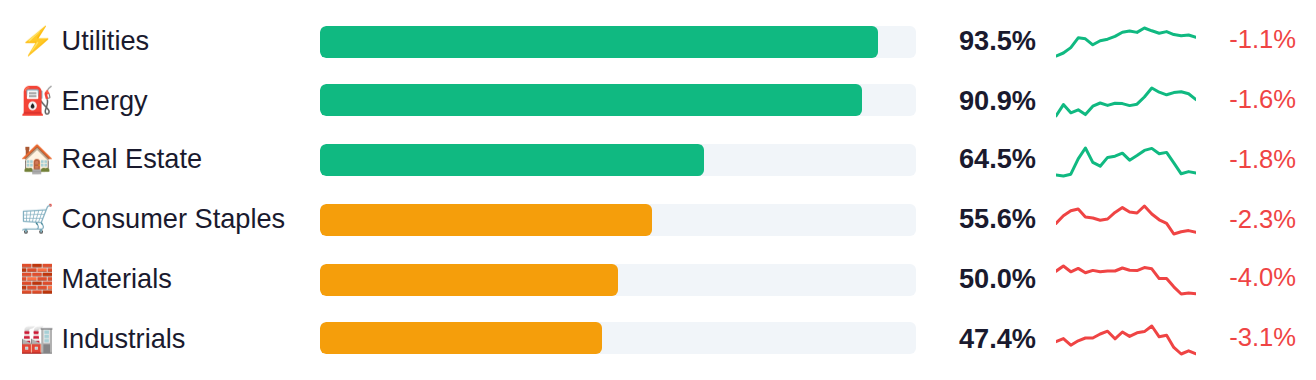
Market leadership has rotated sharply toward defensive sectors, with Utilities and Energy showing strength above 90% while growth-oriented Technology and Consumer Discretionary lag significantly below 30%. The narrow breadth across major indices, with less than half of SPY components participating and QQQ at just 40%, indicates a selectivity-driven environment where investors are concentrating positions in traditionally defensive areas rather than broad-based participation across the market.
As of March 4, the Fed's net liquidity stands at $6.63 trillion, up $15.1 billion week-over-week, with the next H.4.1 release scheduled for Thursday, March 12. Rising liquidity typically correlates with increased cash available in the financial system, which historically has supported asset prices as more capital flows into markets seeking returns.
Existing home sales surged 1.7% in February against expectations for a 0.8% decline, pushing the annualized rate to 4.09M versus the 3.88M estimate—a significant reversal from January's 5.9% plunge that signals mortgage rates in the low-6% range may be pulling buyers off the sidelines after months of paralysis. Today's February CPI report takes center stage with headline inflation expected to hold at 2.4% year-over-year while the monthly rate ticks up to 0.3% from 0.2%, and any upside surprise could reignite concerns about the Fed's path given core inflation has stalled at 2.5% for consecutive months, well above the 2% target. Tomorrow brings a packed slate with January trade balance data (expected to improve from -$98.5B to -$93.0B on goods), initial jobless claims forecast at 217K versus last week's 213K, and February PPI which follows a 0.2% monthly gain in January—all feeding into the narrative of whether the economy is cooling enough to justify rate cuts or remaining too hot.
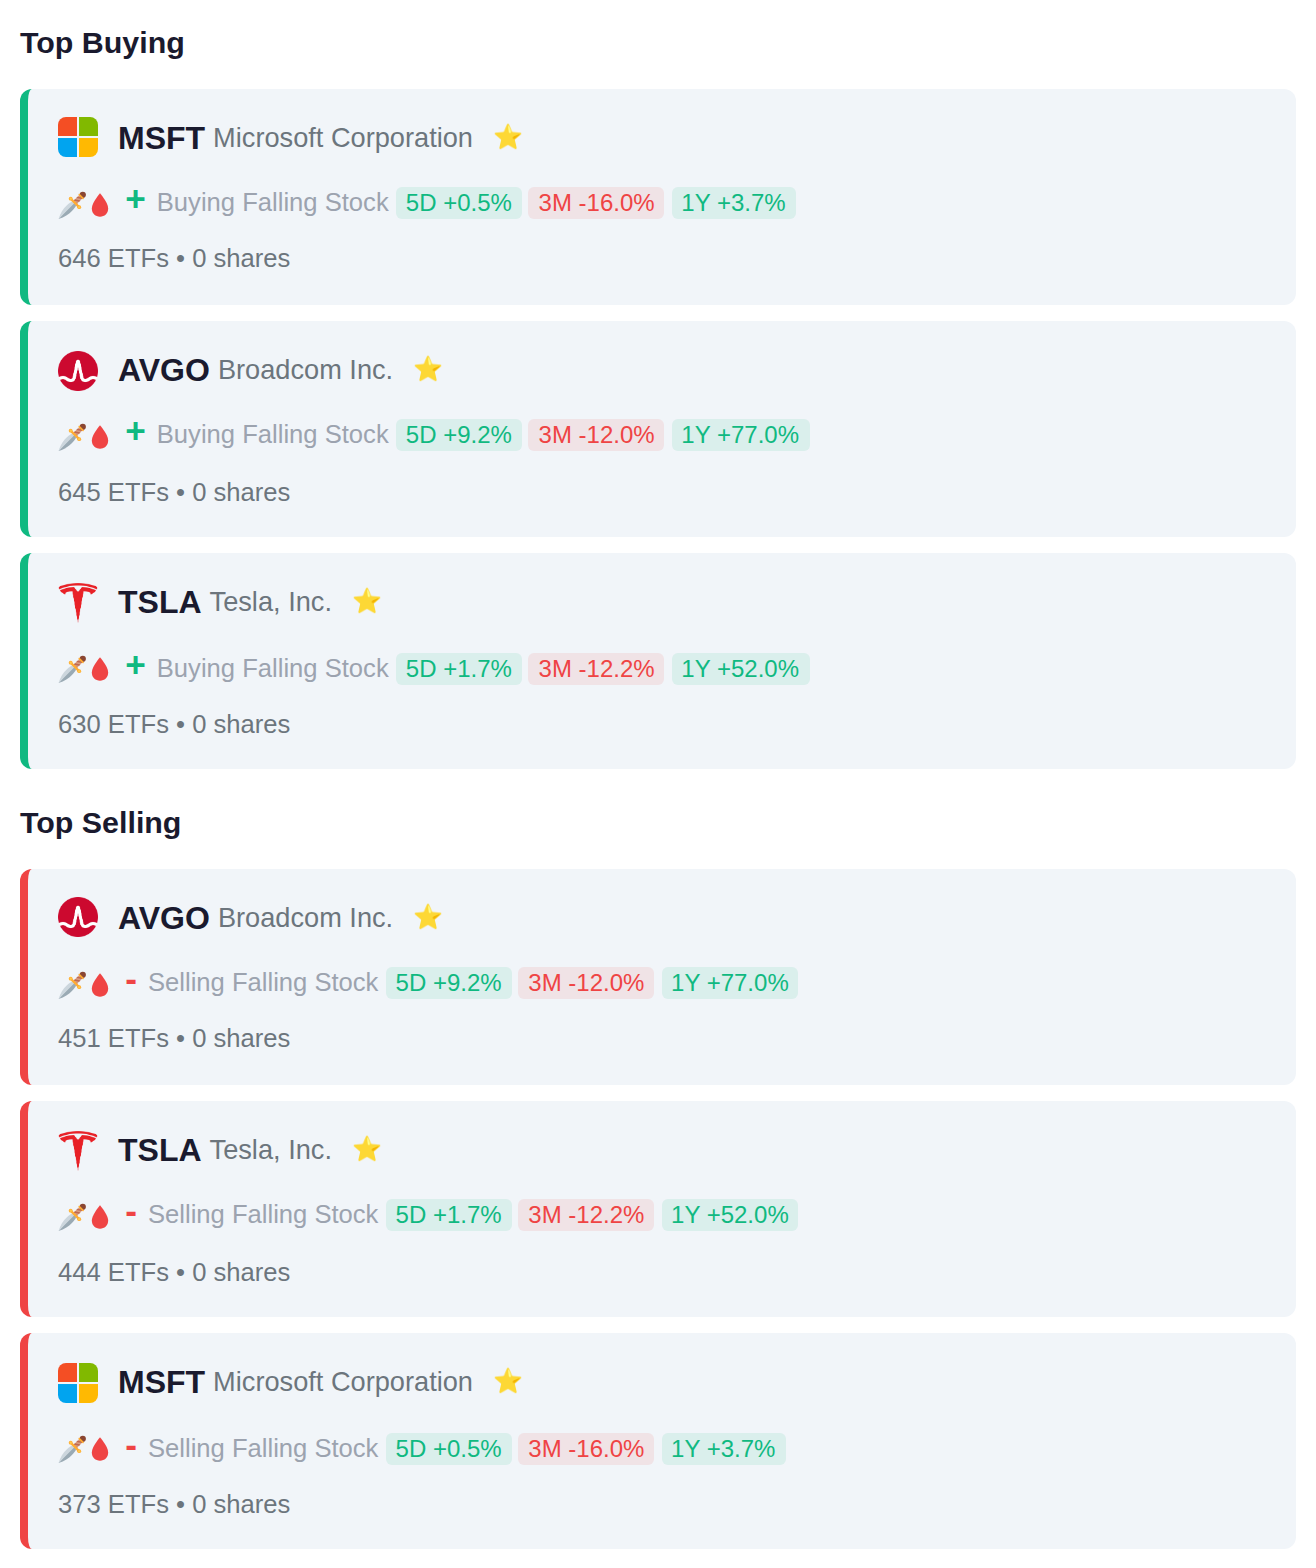
Institutional flows showed mixed positioning in mega-cap technology during the period, with MSFT attracting net additions from 273 ETFs, while AVGO saw net reductions from its highest turnover (1,096 total ETF transactions). The balanced 10-to-10 ratio of ETFs adding versus removing positions across these names suggests sector rotation within technology rather than broad-based conviction, as institutions appeared to rebalance exposure among semiconductor and software holdings.
Congressional members executed multiple technology sector transactions this period, with Rep. David Taylor purchasing shares of both AVGO and AMZN while selling energy refiner MPC, and Rep. Gilbert Cisneros rotating out of THR into FSS. Rep. Pete Sessions reduced his telecommunications position by selling VZ.
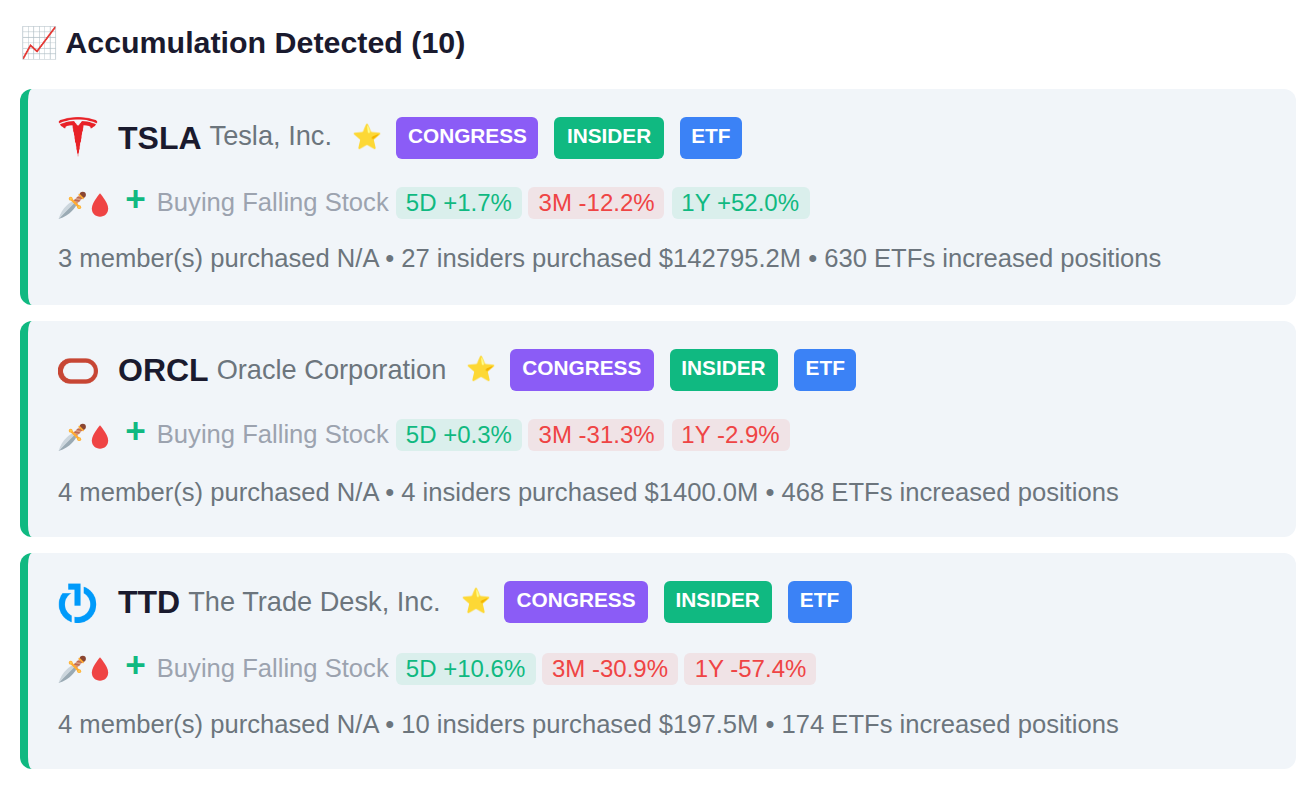
Recent insider filings show concentrated accumulation activity at General Dynamics with 24 insiders recording transactions, followed by Coca-Cola with 11 insiders and The Trade Desk with 9 insiders taking positions. On the distribution side, NRG Energy saw 4 insiders offload $5.3 billion in holdings, while BrightSpring Health Services recorded 5 insiders selling $1.6 billion and Sarepta Therapeutics had 3 insiders dispose of $626.6 million in shares.

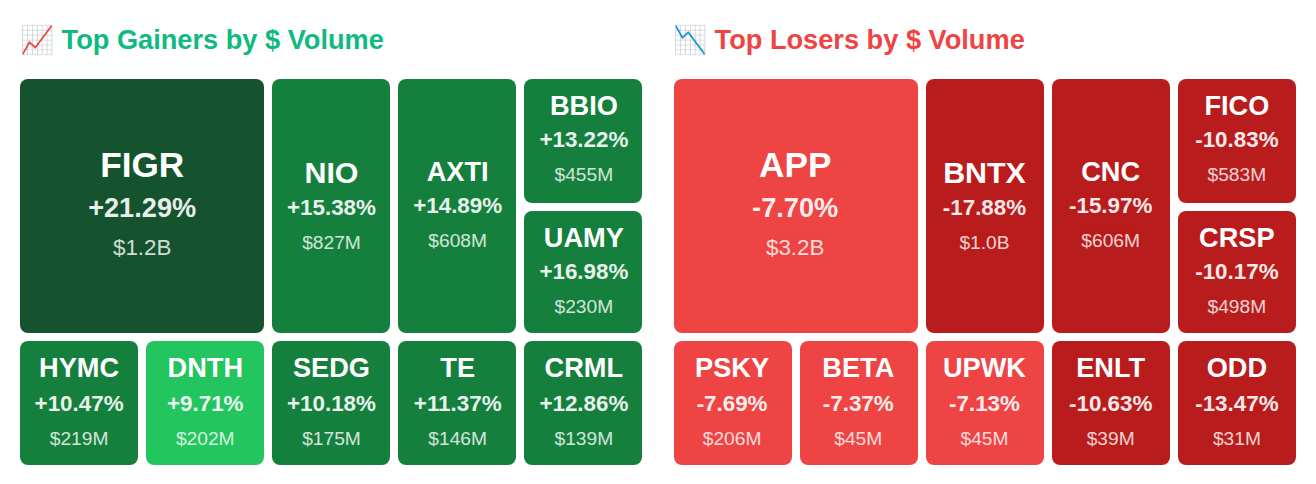
Yesterday's session saw COCXF surge over 1111%, while ORCL.SW advanced 89.5% and STGW gained 24.4%. Among today's 449 reporting companies, TRAN.BA and 086450.KQ are showing accumulation signals with institutional positioning ahead of results, while GOTO.JK and MTEL.JK are displaying distribution patterns as smart money reduced exposure. Tomorrow's calendar includes 289 companies set to report earnings.