The Edge
Know What They Know
🐷 PIG ROAST
💬 Word on the Street
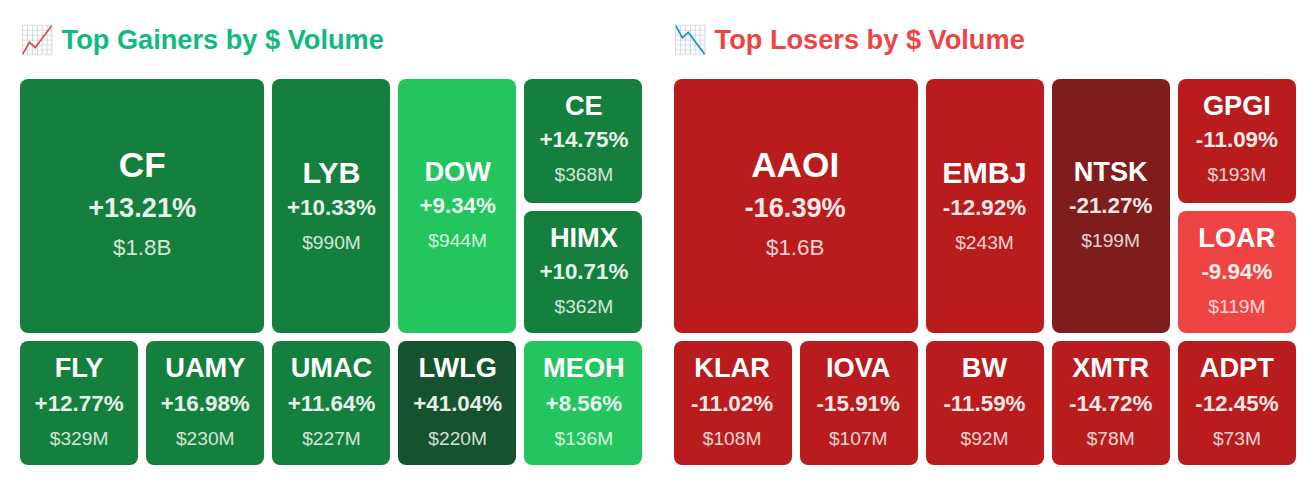
While Rep. Gilbert Cisneros (D-CA) quietly scooped Federal Signal Corporation (FSS) shares worth up to $15,000, four insiders at NRG Energy (NRG) stampeded for the exits with a staggering $5.3 billion in sales—and that's just the tip of today's $11.4 billion net outflow iceberg. Meanwhile, as the VIX spiked 14.6% to 24.2 and the Fed pumped in $17.4 billion of fresh liquidity, chemical stocks CF Industries (CF), LyondellBasell Industries (LYB), and Dow Inc. (DOW) went absolutely vertical in after-hours trading on Middle East chaos and earnings euphoria. Here's what smart money is doing today.
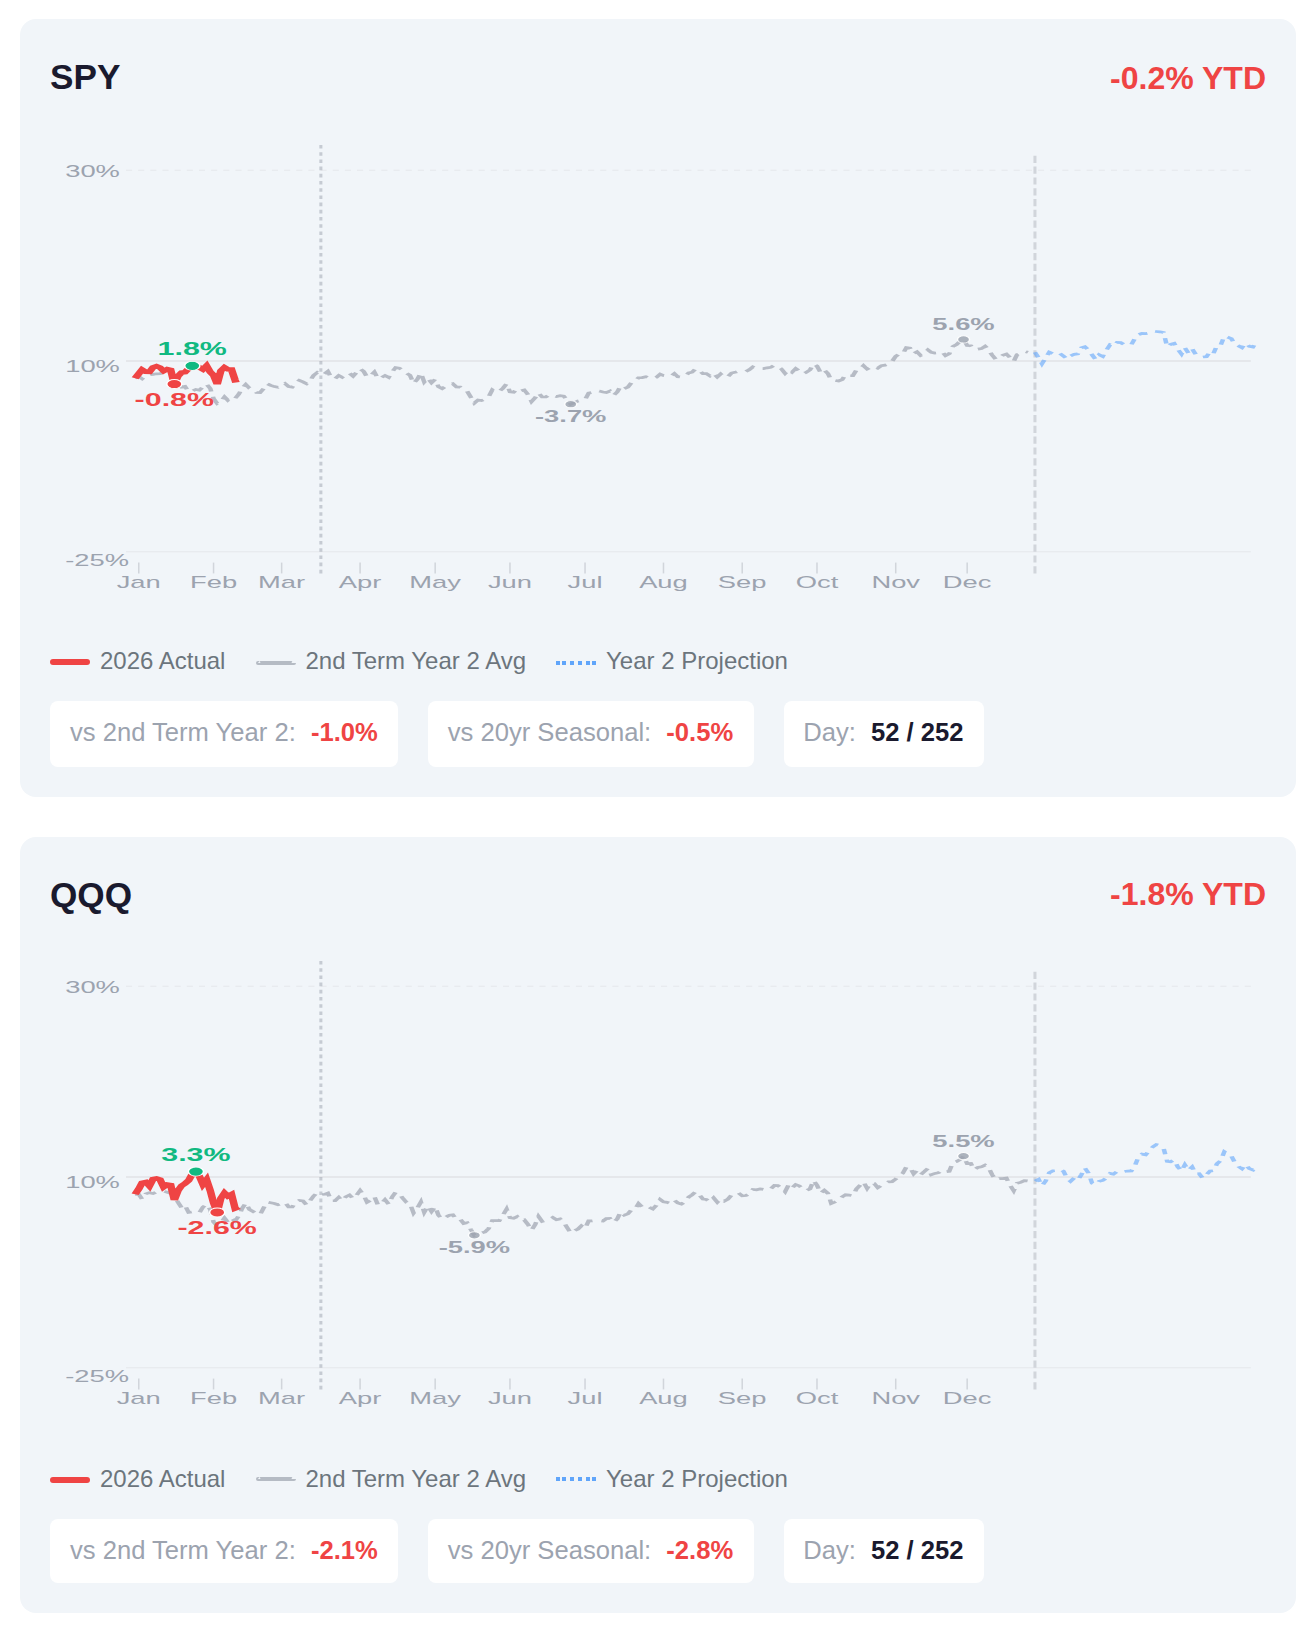
We're roughly 20% through the second year of Trump's second term, and both SPY and QQQ are tracking about a percentage point below their historical averages for this phase of the presidential cycle. The concerning part is we're also lagging the typical 20-year seasonal pattern, with SPY underperforming by half a point despite being in a period that historically adds another 1.5% by mid-March. If the historical second-term Year 2 pattern holds—which has averaged 3.5% full-year returns for SPY—the market would need to add roughly 3.7% over the remaining 200 trading days to match that baseline, though past performance obviously doesn't guarantee these seasonal tailwinds will materialize this time around.
📚 Jargon Buster
Fed Funds Rate
The interest rate banks charge each other overnight. Jerome turns this knob and the entire world screams.
Equity market volatility surged into elevated territory this week, with the VIX climbing 14.6% to reach 24.23, reflecting heightened uncertainty among options traders as fear levels pushed above the typical range. In contrast, bond market volatility told a different story, as the MOVE index declined 12.1% to 12.78, indicating relatively calm conditions in fixed income markets. This divergence between equity and bond volatility suggests investors are pricing in stock-specific concerns rather than broader systemic risks that would typically affect both asset classes simultaneously.

|| Market Sutra ||
"What you measure shapes what you see."
— Investors obsessed with P/E ratios missed Amazon's cash-flow power in the early 2000s
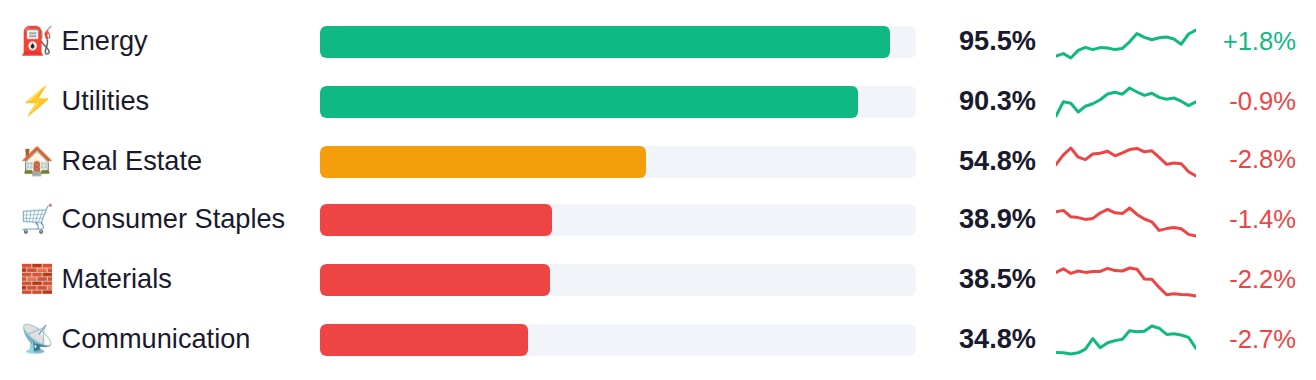
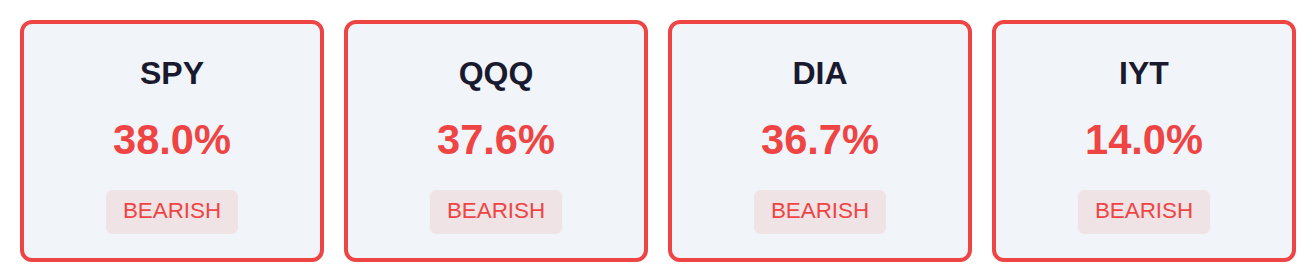
Market breadth remains compressed with major indices showing only 37-38% of constituents above their moving averages, while transportation stocks lag further at just 14%. Defensive sectors including Energy, Utilities, and Real Estate are demonstrating relative strength with 55-96% participation, contrasting sharply with growth-oriented areas like Semiconductors and Consumer Discretionary showing participation rates below 30%. This defensive leadership pattern typically emerges when investors rotate away from cyclical and technology exposures toward more traditionally stable sectors.
As of March 11, Fed net liquidity stood at $6.65 trillion, increasing $17.4 billion week-over-week, with the next H.4.1 release scheduled for Thursday, March 19. This uptick in liquidity typically correlates with easier financial conditions and increased risk asset support, as more liquidity in the system generally reduces funding pressures and provides additional capital available for market deployment.
Yesterday's data painted a mixed picture as housing starts surged 7.2% to 1.487M (well above the 1.35M estimate), while building permits dropped 5.4% against expectations of a 1.42% increase—suggesting the strong starts print may not sustain as permits typically lead actual construction activity. The trade deficit narrowed sharply to $54.5B from $72.9B (versus $66.6B expected), driven by a $14.8B jump in exports to $302.1B, while the Atlanta Fed raised its Q1 GDP tracking estimate to 2.7% from 2.1%, indicating resilient growth momentum despite tightening financial conditions. Today's focus shifts to the Q4 GDP second revision (expected at 1.4% versus the prior 4.4% print, marking a significant deceleration) and January's PCE inflation data, where core PCE month-over-month is estimated to hold steady at 0.4%—a pace that would keep the Fed cautious about rate cuts given its status as the central bank's preferred inflation gauge.
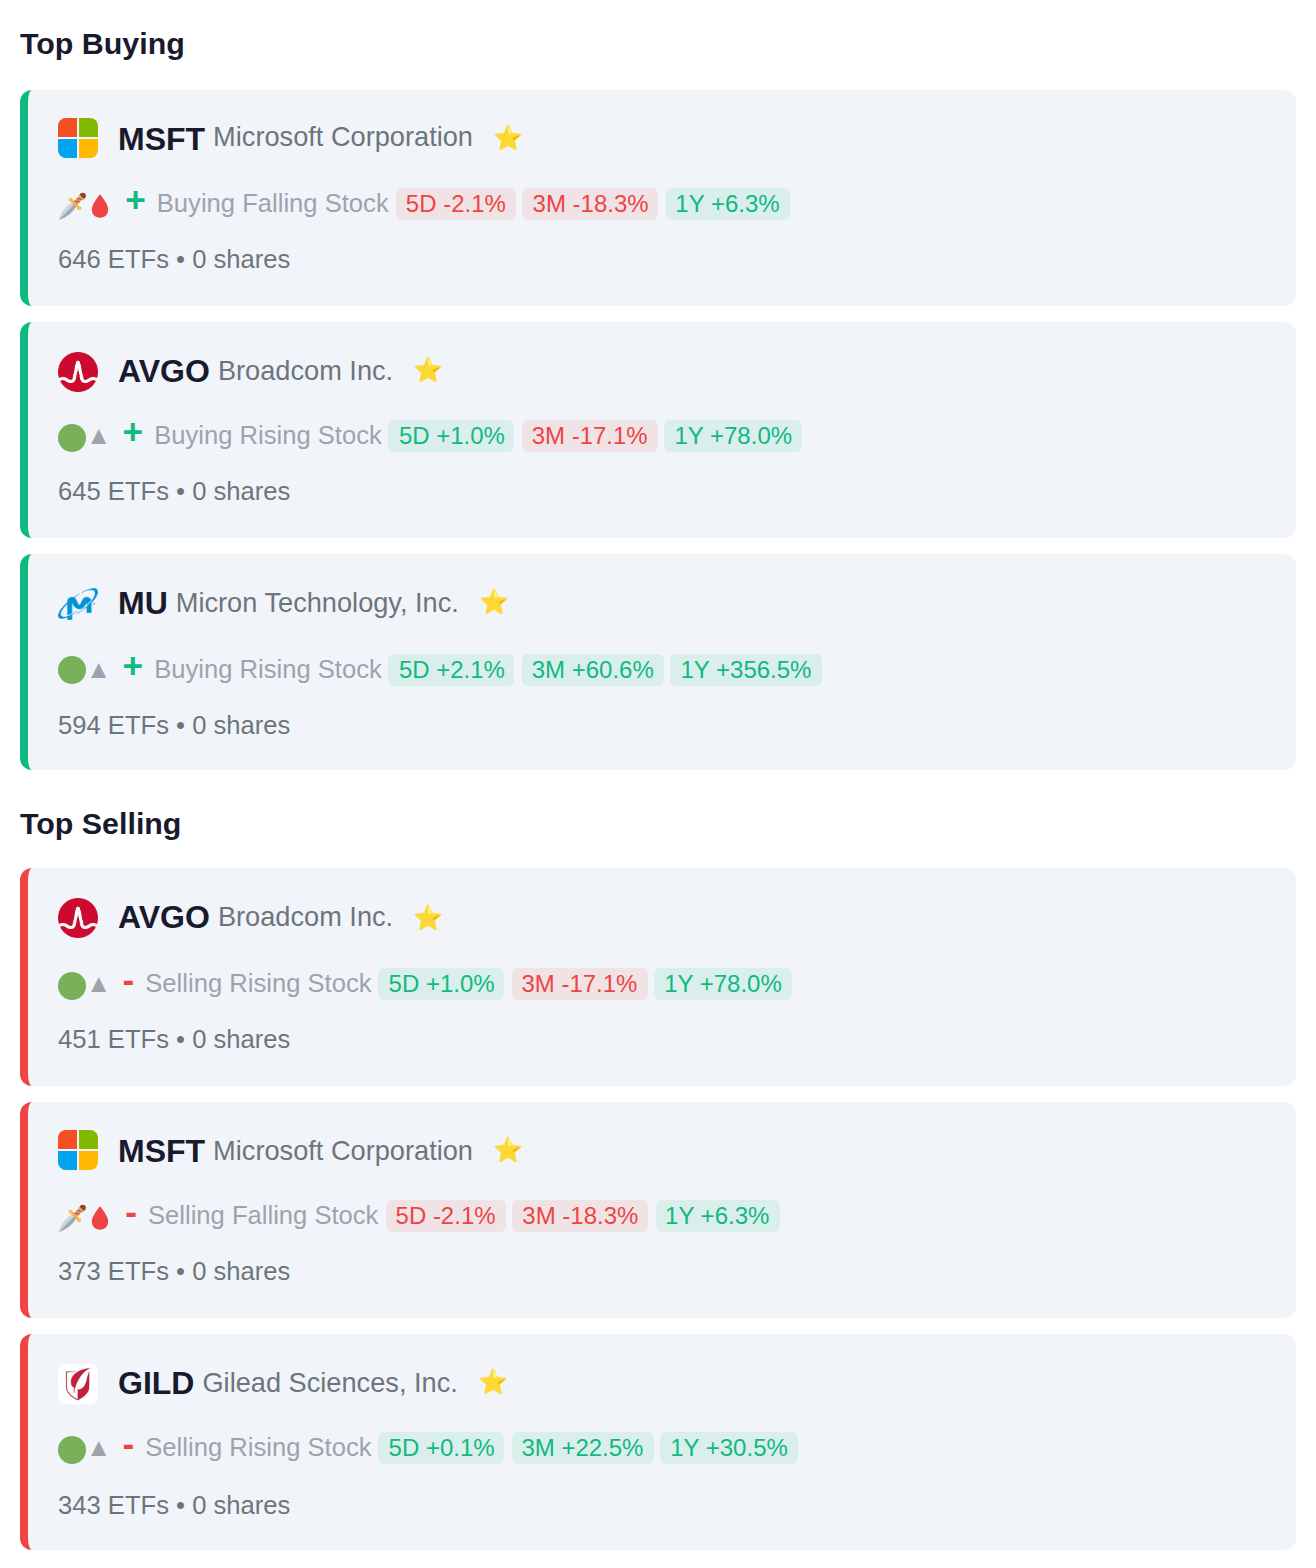
Institutional activity shows a split decision on mega-cap technology, with 646 ETFs adding MSFT positions while 373 reduced them, and similar two-way flow in AVGO (645 adding, 451 removing), suggesting portfolio rebalancing within the semiconductor and software space. Memory chipmaker MU attracted 594 ETF buyers amid the AI infrastructure buildout, while healthcare name GILD saw 343 ETFs trim positions, indicating a potential rotation from defensive sectors into cyclical technology exposure.
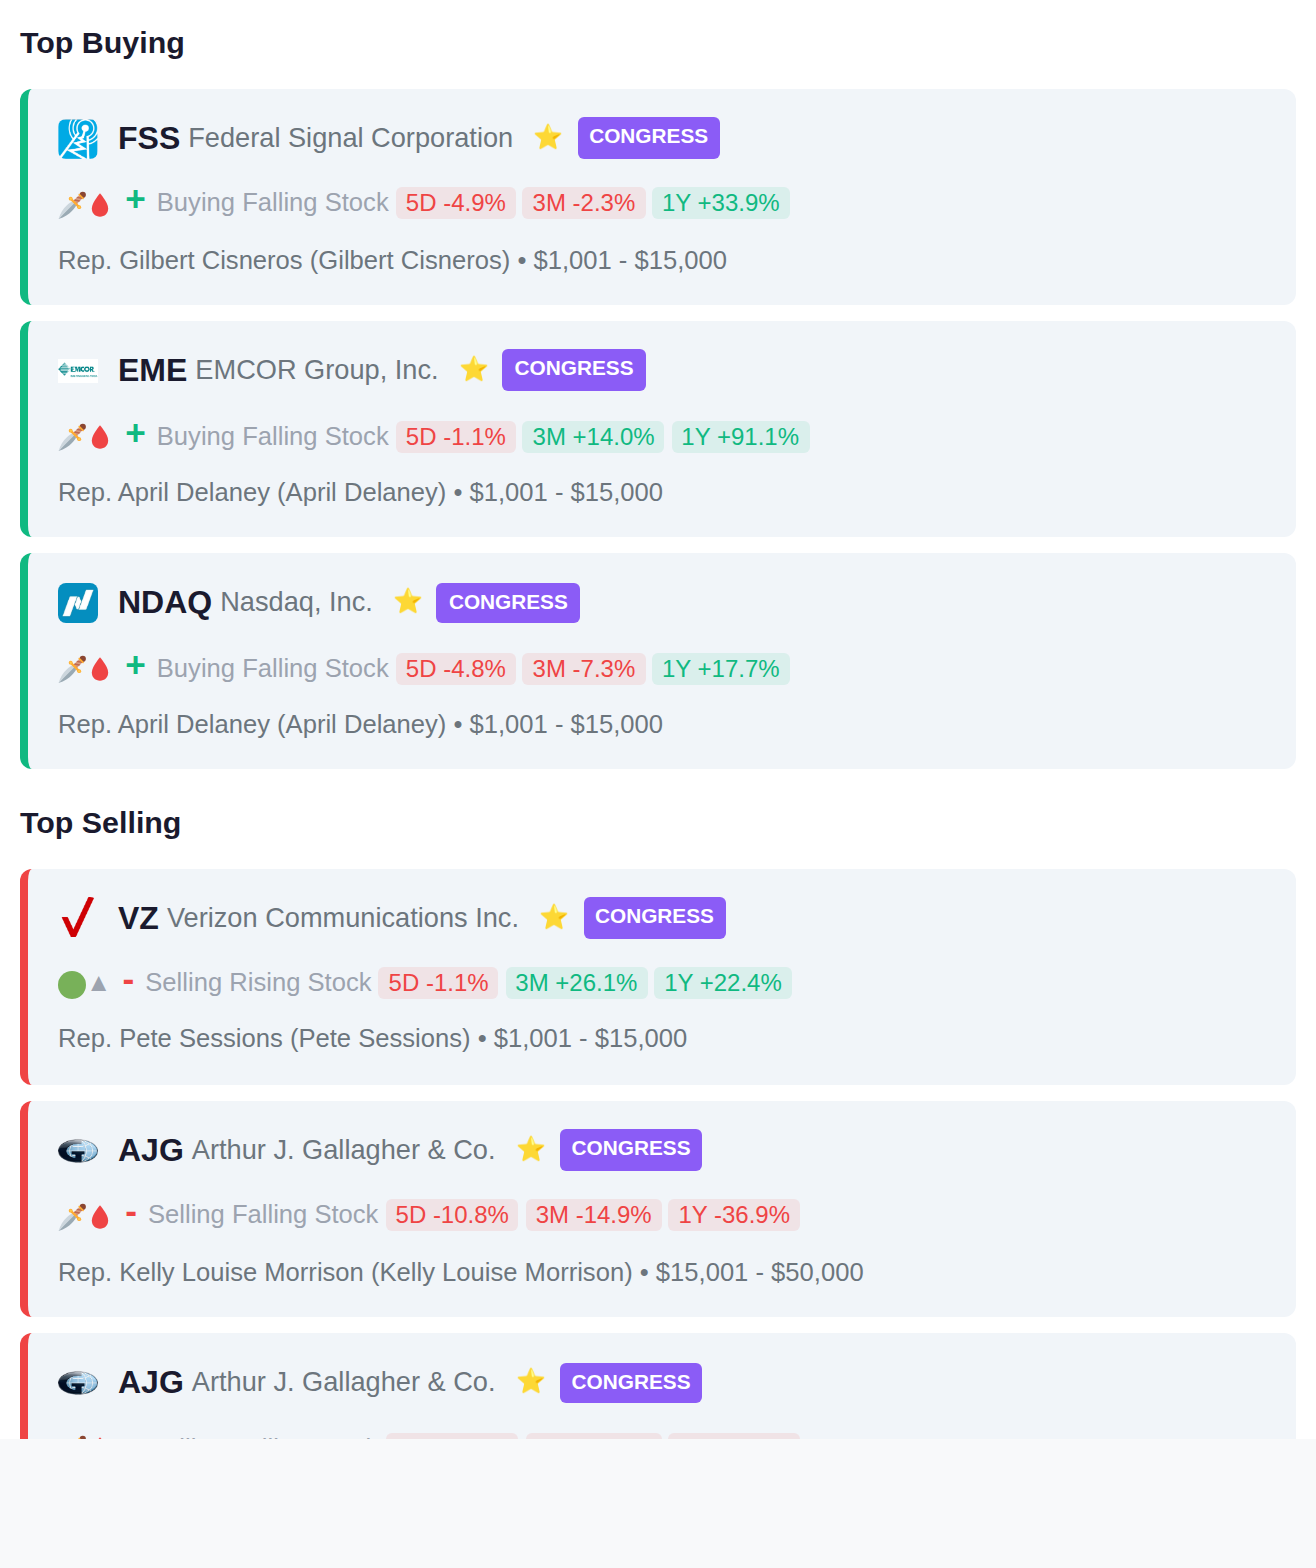
Congressional trading activity shows purchases in financial services, with Rep. Gilbert Cisneros acquiring Federal Signal Corporation (FSS) and Rep. April Delaney adding positions in both EMCOR Group (EME) and Nasdaq Inc. (NDAQ). On the selling side, Rep. Pete Sessions exited Verizon Communications (VZ) while Rep. Kelly Louise Morrison reduced holdings in Arthur J. Gallagher & Co. (AJG) across two transactions.
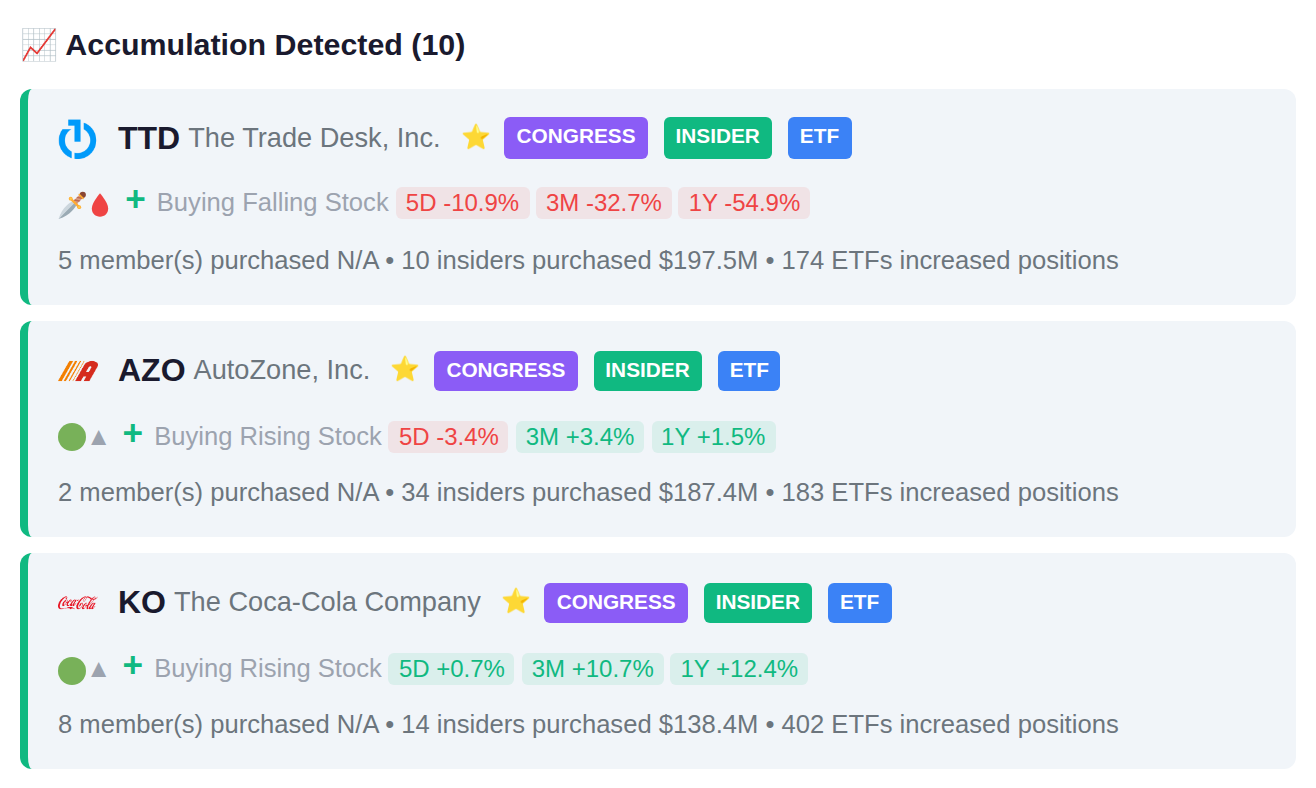
Multiple insiders accumulated shares at The Trade Desk (9 insiders), General Dynamics (24 insiders), and Alkami Technology (6 insiders) during the reporting period. On the distribution side, clusters of insiders sold positions at NRG Energy (4 insiders, $5.3B), Medallia (5 insiders, $2.2B), and BrightSpring Health Services (5 insiders, $1.6B).

Yesterday's session saw significant volatility with RWE.SW surging 89.8% while GPGI declined 23.7%. Today's earnings calendar features 282 reporting companies, with institutional activity showing accumulation in INKP.JK and VAPORES.SN, while smart money has been distributing shares of BRPT.JK and ARTO.JK ahead of their reports. Tomorrow's slate includes 186 companies scheduled to report quarterly results.