The Edge
Know What They Know
🐷 PIG ROAST
💬 Word on the Street
While Rep. Gilbert Cisneros (D-CA) quietly scooped up Federal Signal Corporation (FSS) worth up to $15,000, NRG Energy (NRG) insiders stampeded for the exits with $5.3 billion in sales—the kind of lopsided action that makes you wonder who knows something we don't. After hours, NVIDIA's (NVDA) robot cloud partnership sent Nebius Group (NBIS) rocketing 15% to $129.85, while Circle Internet Financial (CRCL) jumped 9.1% on Visa stablecoin deals, proving once again that AI hype and crypto infrastructure are the only games Wall Street wants to play. Here's what smart money is doing today.
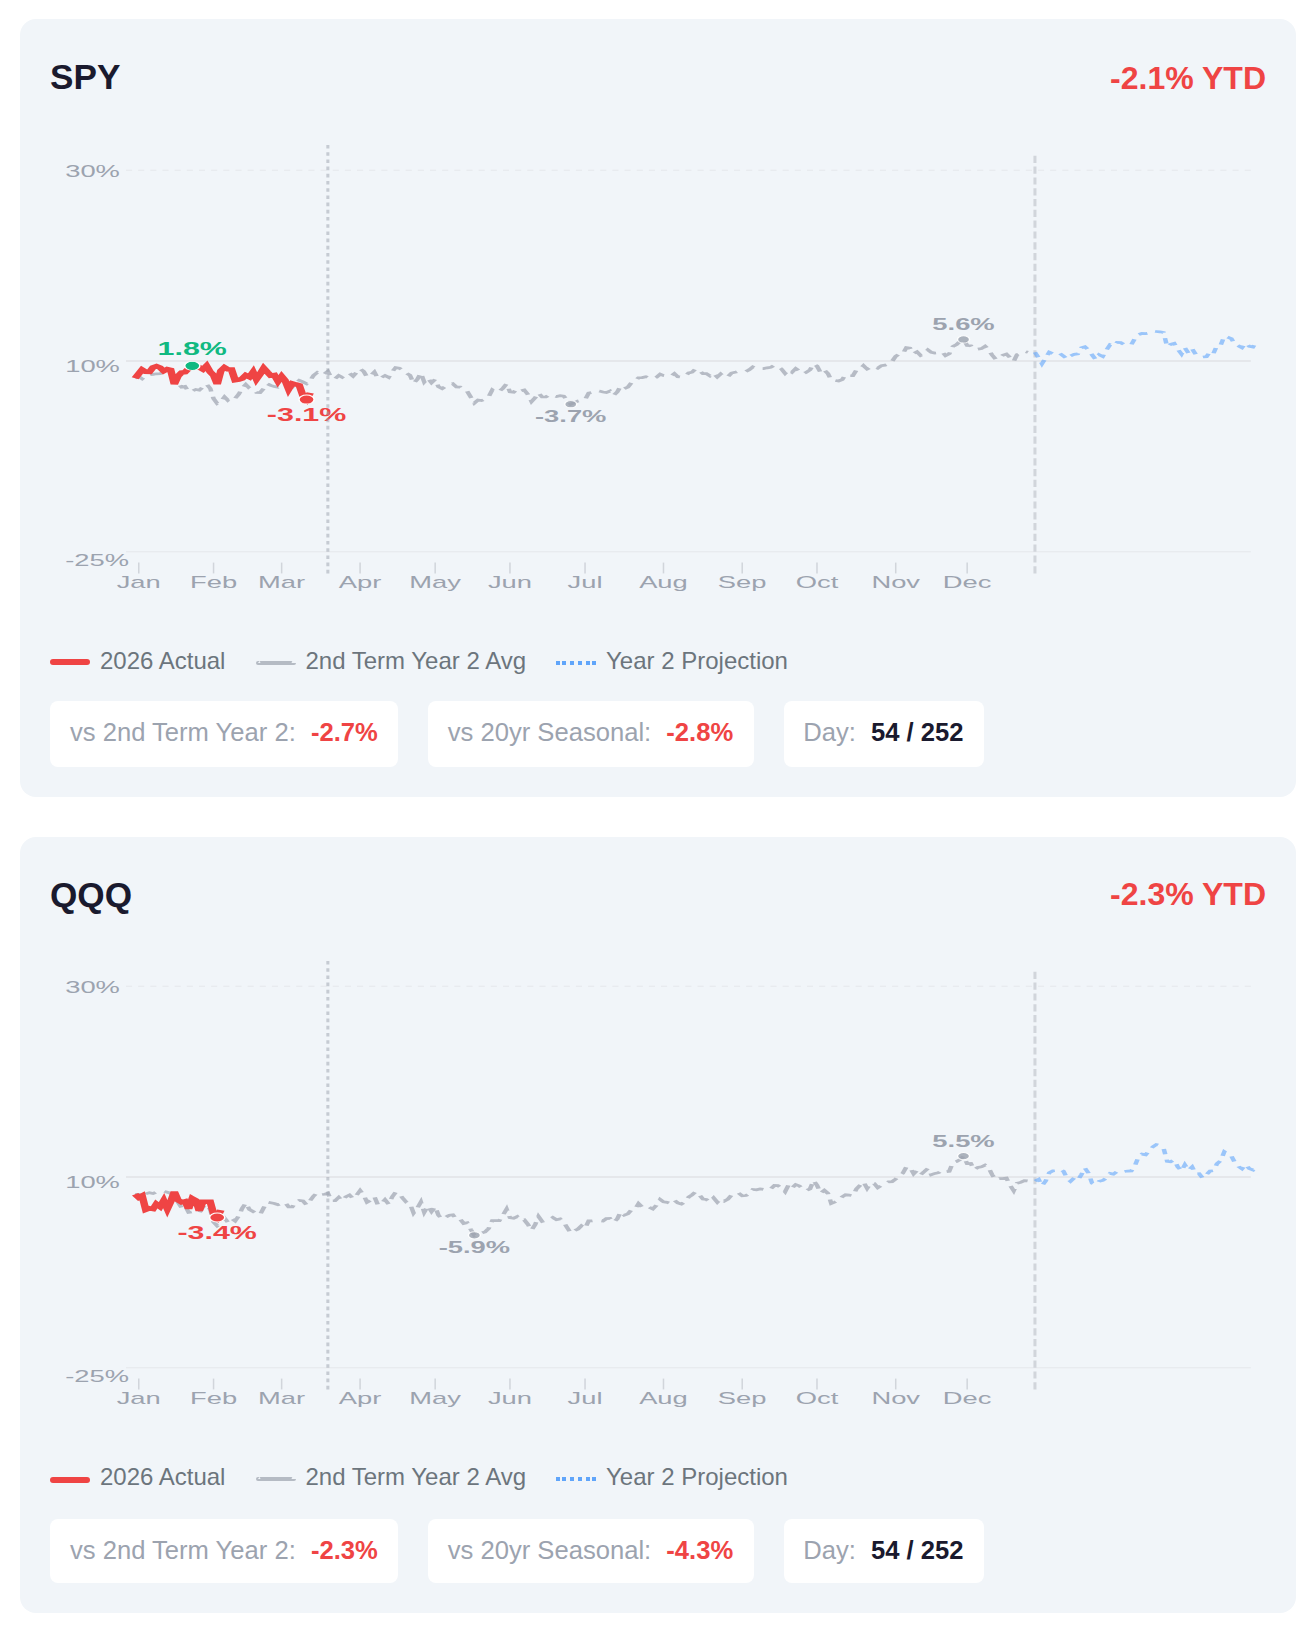
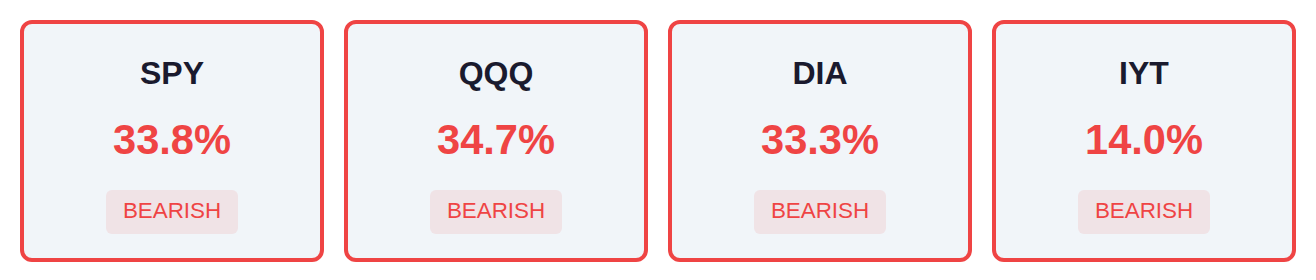
We're 54 trading days into Year 2 of Trump's second term, and both SPY and QQQ are running roughly 2-3% below their historical pace for this point in the presidential cycle—SPY sits at -2.1% YTD versus a typical Year 2 full-year gain of around 3.5%, while QQQ shows similar underperformance at -2.3% year-to-date. Historical patterns for second-term Year 2 cycles suggest another 1.5% of upside typically materializes by mid-March in Q1, though current positioning indicates the market would need to recover about 4-5% just to align with the average trajectory. If the typical Year 2 pattern holds for the remainder of 2025, we'd be looking at a path toward positive mid-single-digit returns by year-end, but that assumes a meaningful reversal from the current below-trend performance in the coming weeks.
📚 Jargon Buster
Hawkish
Fed talking like your angry dad who caught you sneaking out. Higher rates, sell everything, go to your room.
Equity volatility remains elevated with the VIX at 27.19, though the 7.8% weekly decline suggests some easing of fear in stock markets from even higher levels. Bond market volatility tells a different story, with the MOVE index at a relatively calm 14.43 despite rising 7.7% over the week, indicating fixed income traders are experiencing significantly less stress than their equity counterparts. This divergence between stock and bond volatility measures reflects an uneven distribution of uncertainty across asset classes, with equity investors still pricing in considerable near-term risk while bond markets appear more stable.

|| Market Sutra ||
"Confidence rallies fade faster than conviction rallies."
— Post-earnings pops without volume often retrace within days
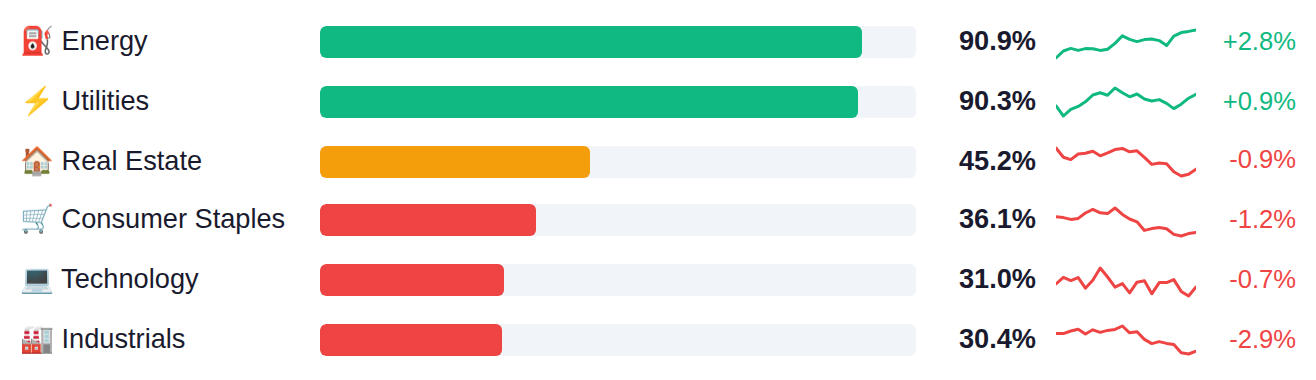
Market breadth remains weak across major indices, with roughly one-third of SPY, QQQ, and DIA constituents trading above key technical levels, while transports show even more pronounced weakness at just 14%. A notable divergence has emerged between defensive sectors like Energy and Utilities commanding the leadership at 90%+ and growth-oriented areas such as Semiconductors and Consumer Discretionary lagging significantly in the low-20% range. This rotation pattern typically reflects investor positioning toward more defensive characteristics while risk-sensitive segments experience reduced participation.
As of March 11, Fed net liquidity stands at $6.65 trillion, up $17.4 billion week-over-week, indicating an expansion in system-wide liquidity that historically correlates with supportive conditions for risk assets. The next H.4.1 Federal Reserve balance sheet release is scheduled for Thursday, March 19, which will show whether this liquidity expansion trend continues.
Yesterday's data painted a mixed picture as the NY Empire State Manufacturing Index slumped to -0.2 against expectations of 3.2, marking a sharp reversal from February's 7.1 reading and returning to contraction territory for the first time since December, while Industrial Production's 0.2% gain doubled the 0.1% estimate despite decelerating from January's 0.7% pace. The housing sector showed modest stabilization with the NAHB index ticking up to 38.0 from 37.0, though builder sentiment remains deeply depressed near levels last seen during the 2008 financial crisis outside of the pandemic spike. Tomorrow's Fed decision takes center stage with markets pricing in a hold at 3.75%, but the focus will be on whether the updated economic projections signal any shift in the rate outlook amid persistent concerns over manufacturing weakness and stubborn inflation, with today's PPI data—expected at 0.3% for both headline and core—serving as the final inflation datapoint before the Fed announces.
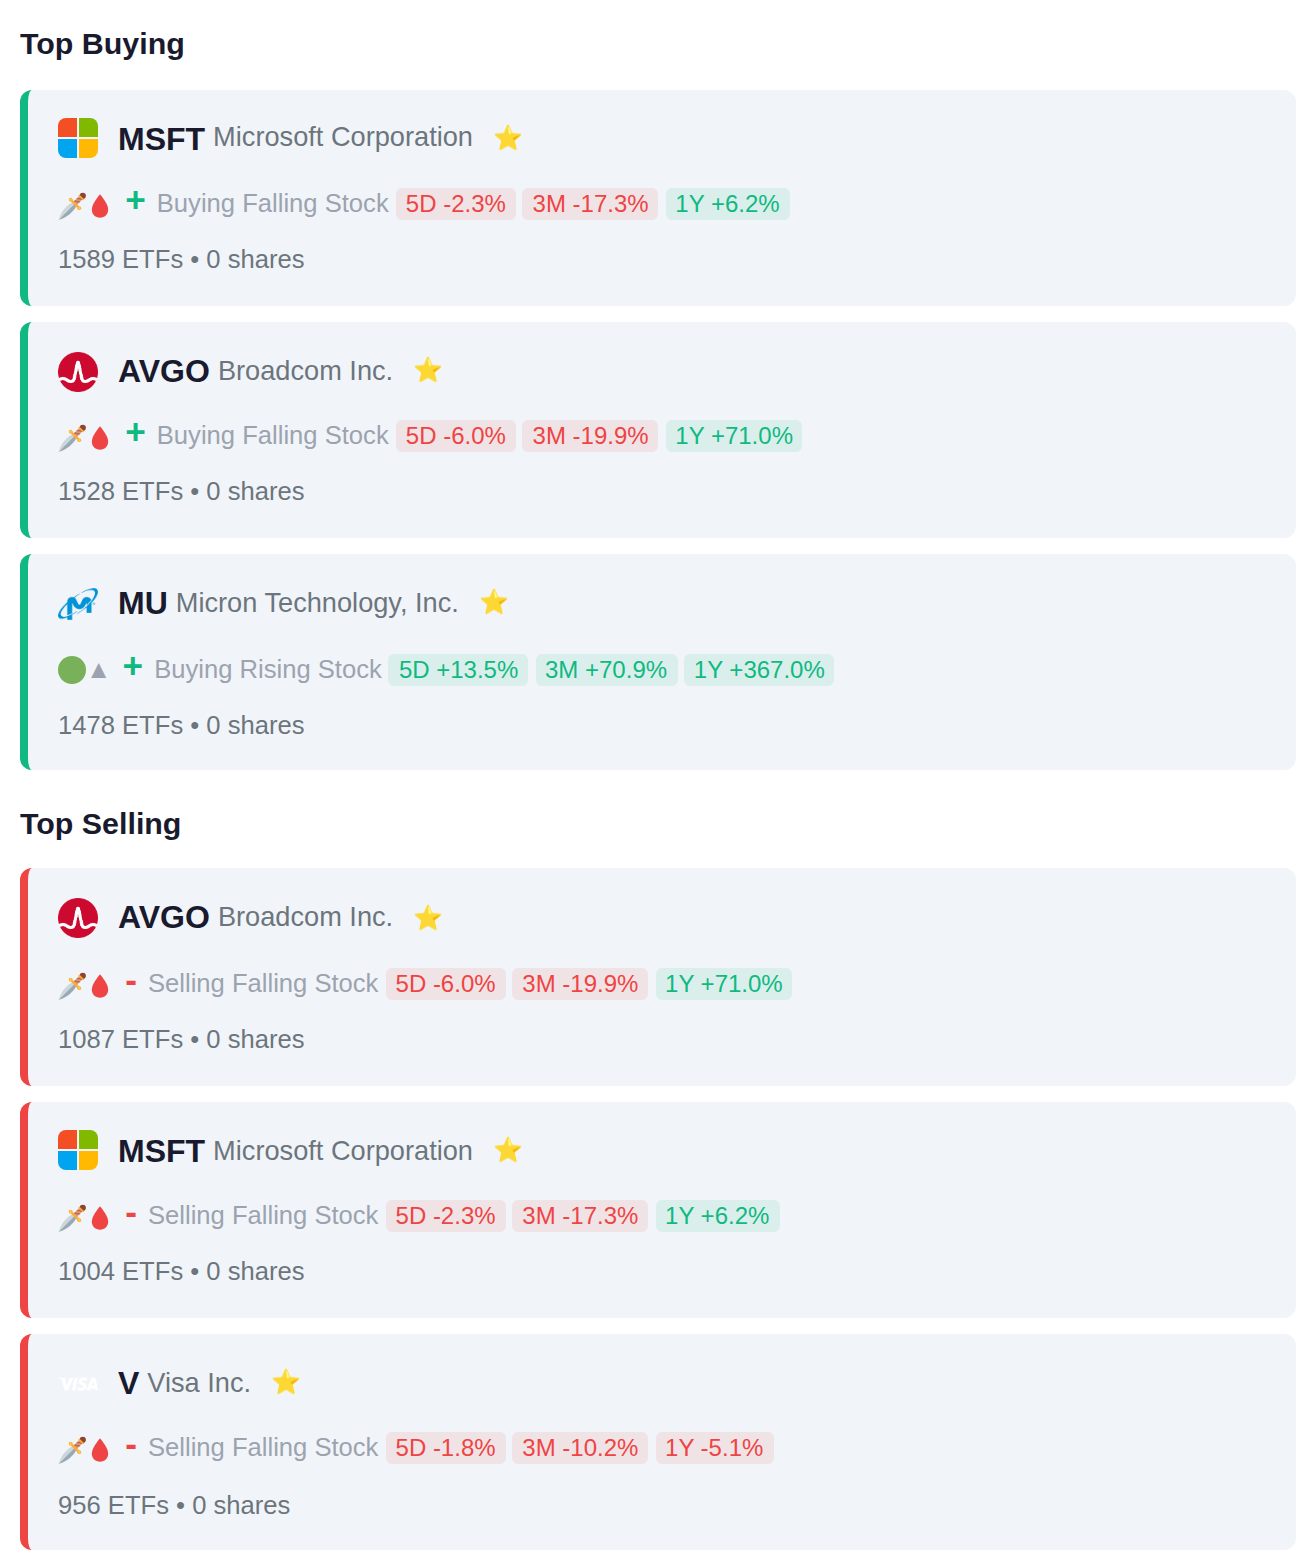
Exchange-traded funds showed mixed positioning in mega-cap technology during the period, with 1,589 ETFs adding Microsoft exposure while 1,004 reduced it, and 1,528 adding Broadcom positions while 1,087 trimmed them. The split action suggests institutional rotation within the technology sector rather than wholesale entry or exit, with semiconductor exposure via Micron and Broadcom attracting net inflows while payment processor Visa faced net redemptions.
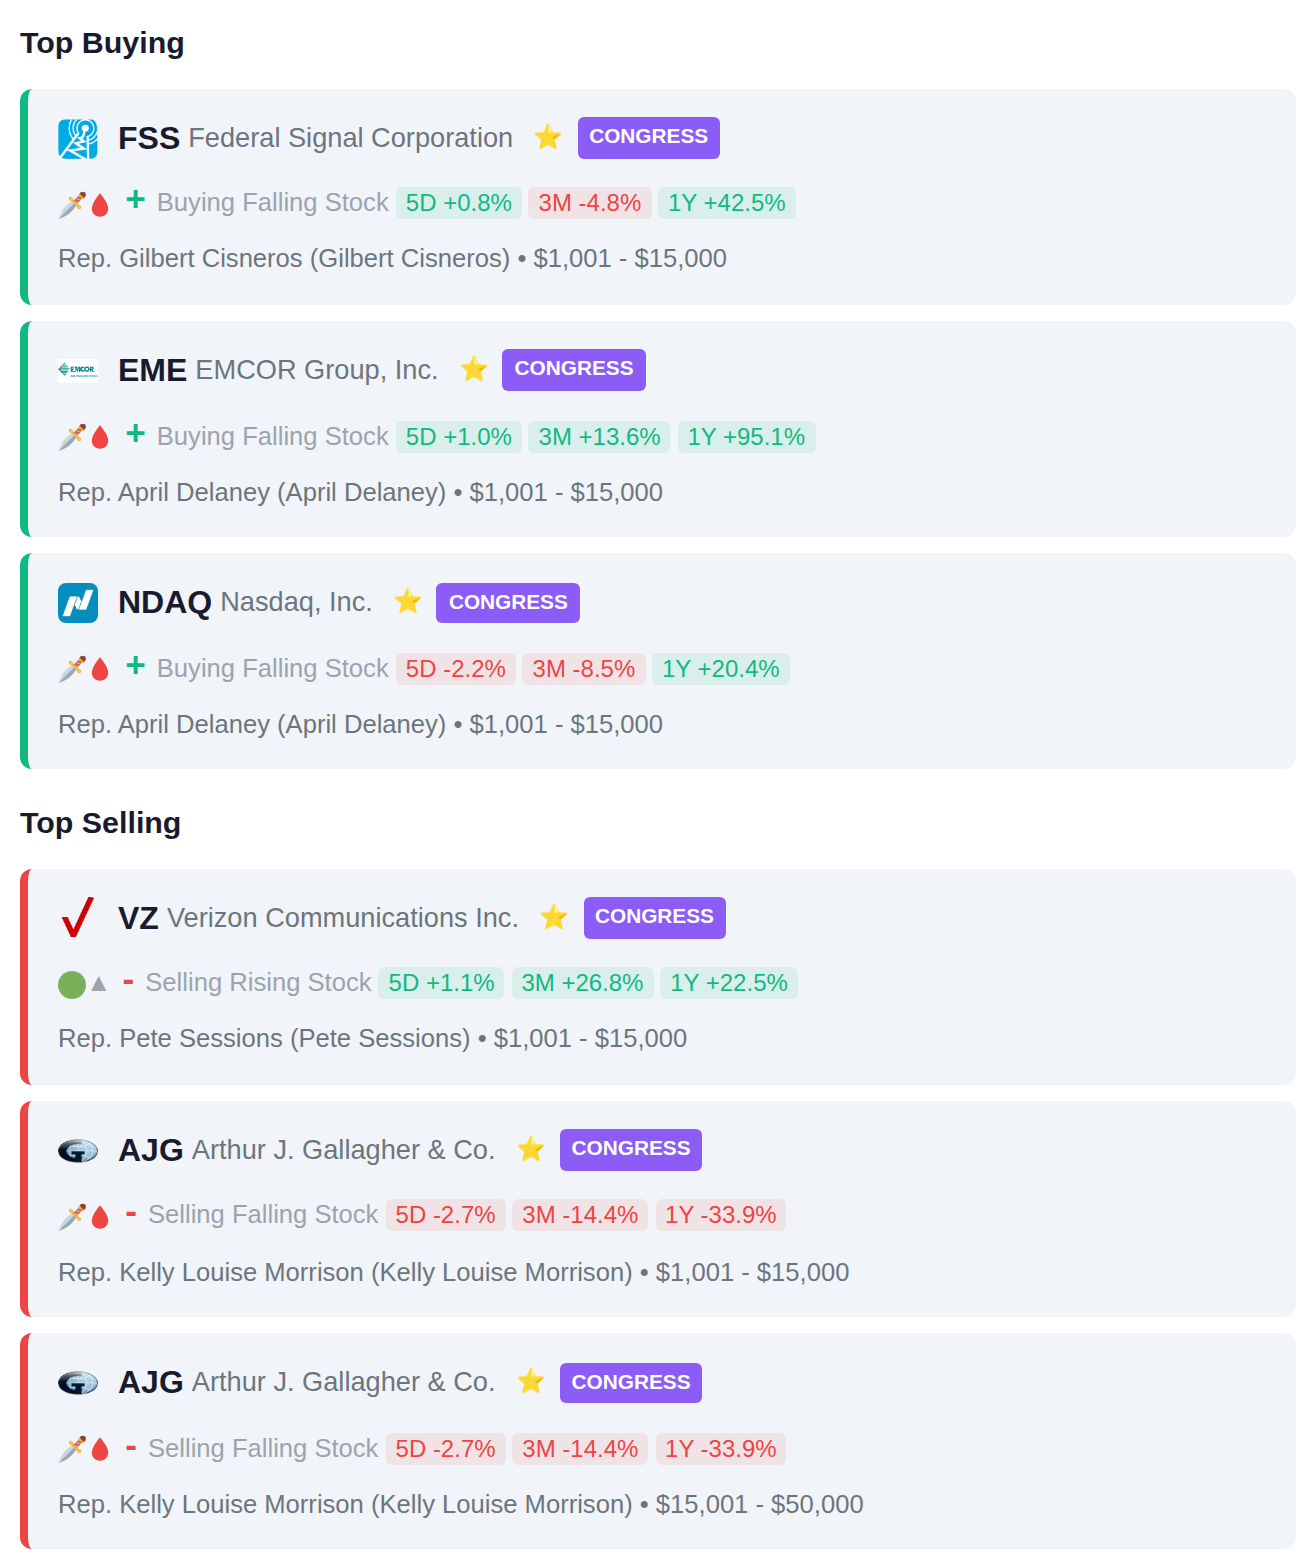
Rep. April Delaney purchased shares of both EME and NDAQ, while Rep. Kelly Louise Morrison executed two separate sales of AJG during the reporting period. Additional congressional activity included Rep. Gilbert Cisneros purchasing FSS and Rep. Pete Sessions selling VZ, with the notable pattern being Morrison's multiple divestments from the same insurance brokerage position.
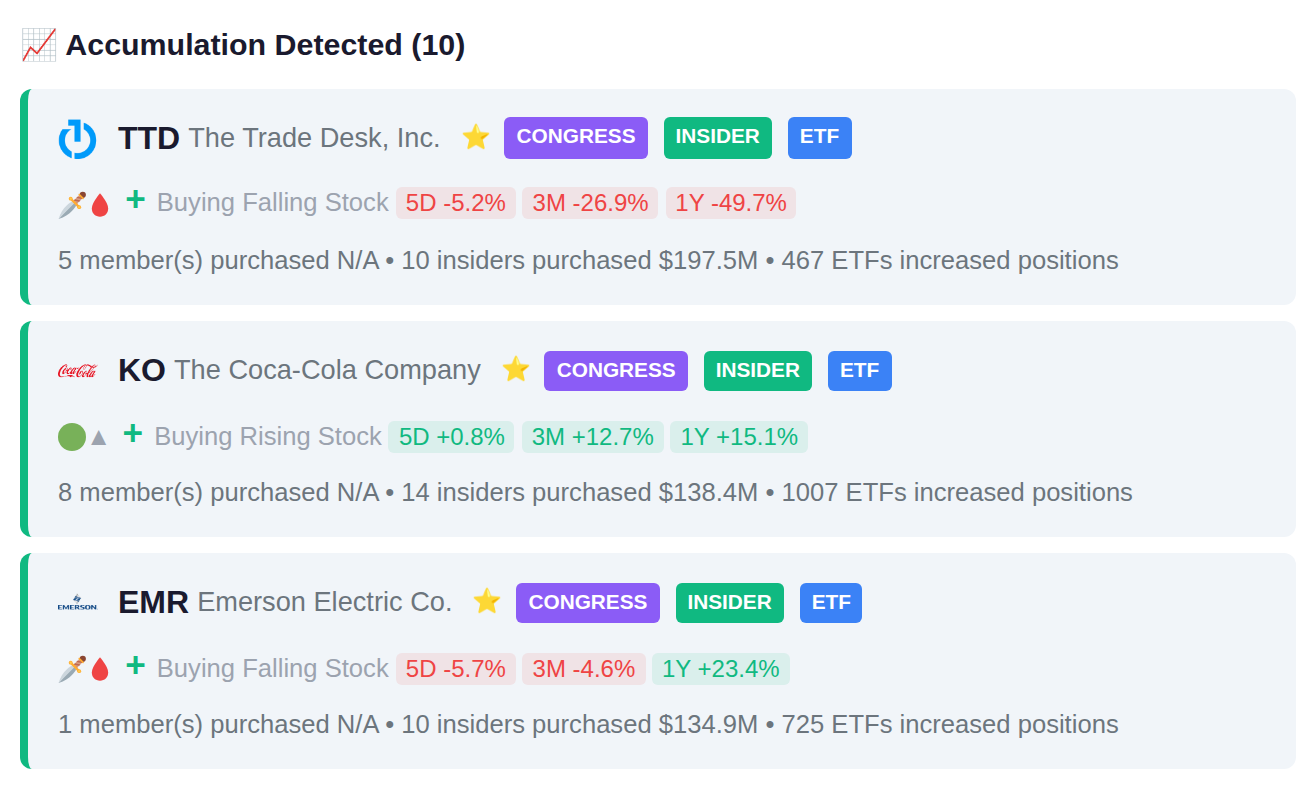
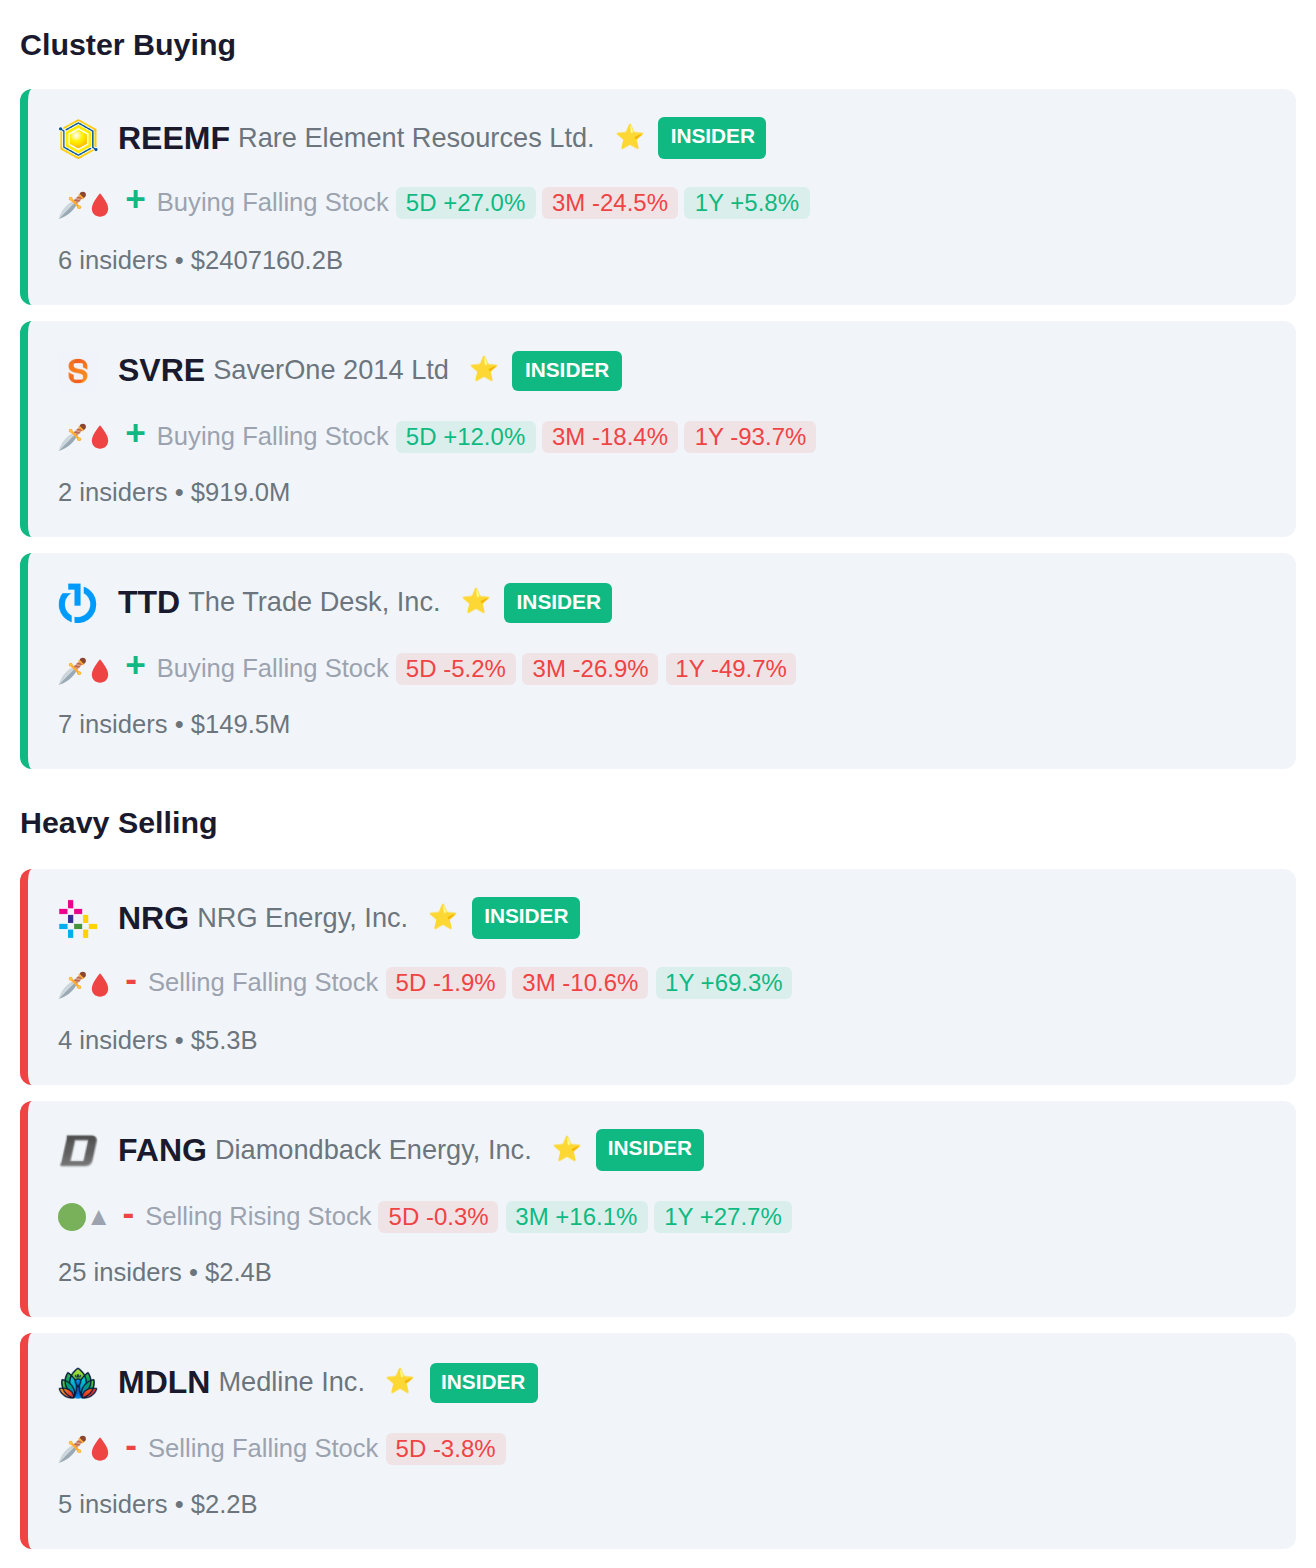
Recent insider filings show concentrated cluster activity with 7 insiders at TTD adding positions while 25 insiders at FANG collectively reduced their stakes by $2.4B. The heaviest selling occurred at NRG where 4 insiders distributed $5.3B in shares, representing the largest single-company insider transaction by dollar value this period.
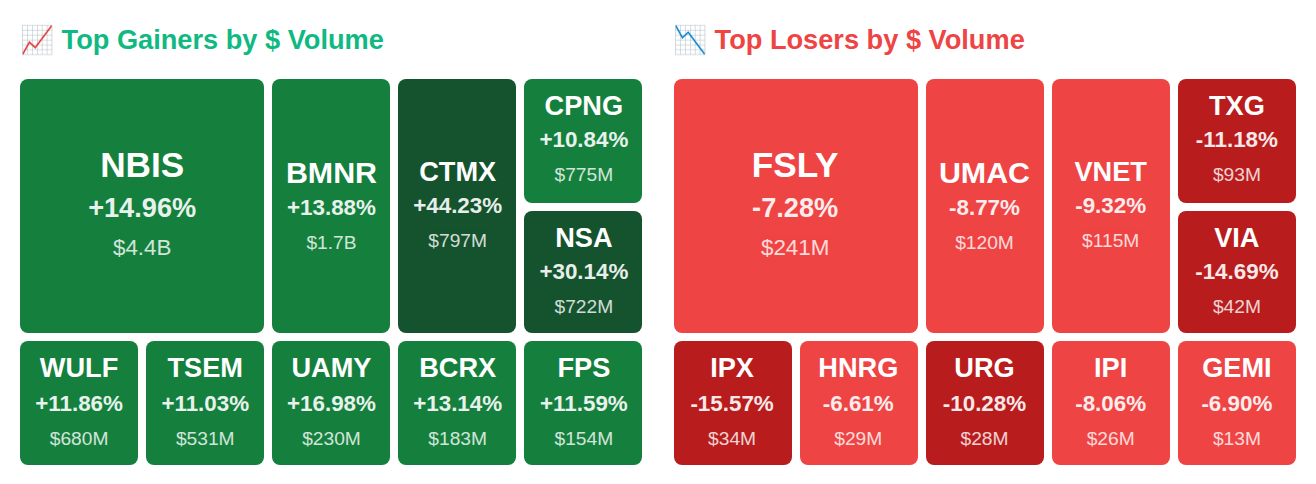
Today 322 companies report earnings, with accumulation signals detected in INKP.JK and VAPORES.SN ahead of their releases, while 2317.TW and 2318.HK show distribution patterns from institutional holders. Yesterday's session saw notable moves in CTMX, which gained 34.2%, alongside double-digit advances in GNNSF and 2383.TW. Tomorrow's calendar includes 202 reporting companies.