The Edge
Know What They Know
🐷 PIG ROAST
💬 Word on the Street
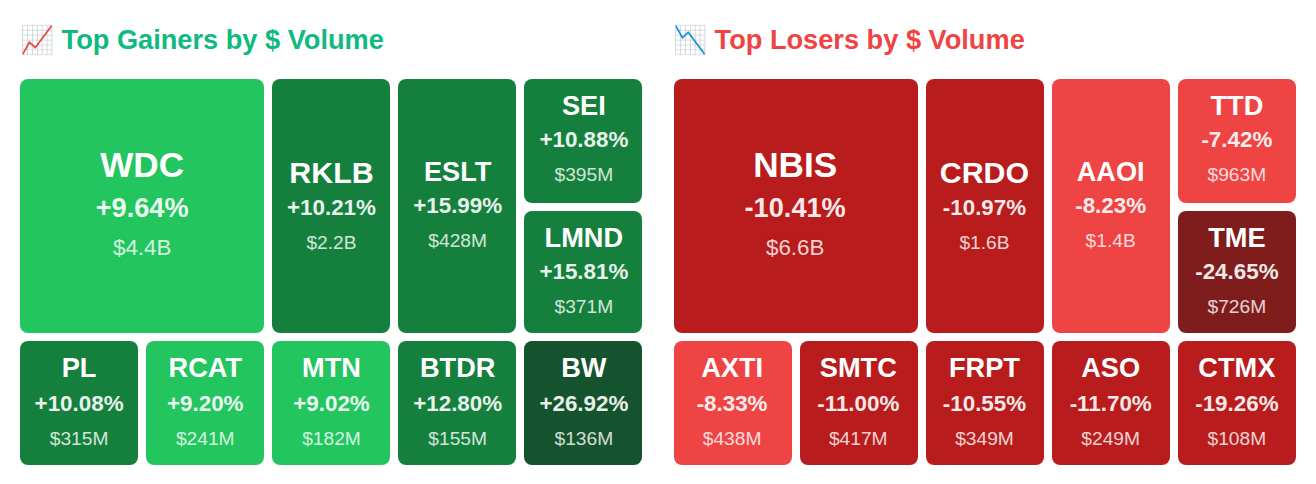
While the VIX plunged 7.8% to 23.5 and Rep. Gilbert Cisneros (D-CA) quietly picked up Federal Signal Corporation (FSS) shares worth $1,001 to $15,000, five insiders at NRG Energy (NRG) stampeded for the exits with $5.3 billion in sales—the kind of number that makes you wonder what they know that we don't. Meanwhile, after-hours action turned space stocks into the market's new casino, with Rocket Lab USA (RKLB) rocketing 10.2% to $78 and AST SpaceMobile (ASTS) climbing 7.4% to $95 on launch hype, even as Western Digital (WDC) surged 9.6% to $313 while big institutions like Cinctive dumped 73% of their stakes. Here's what smart money is doing today.
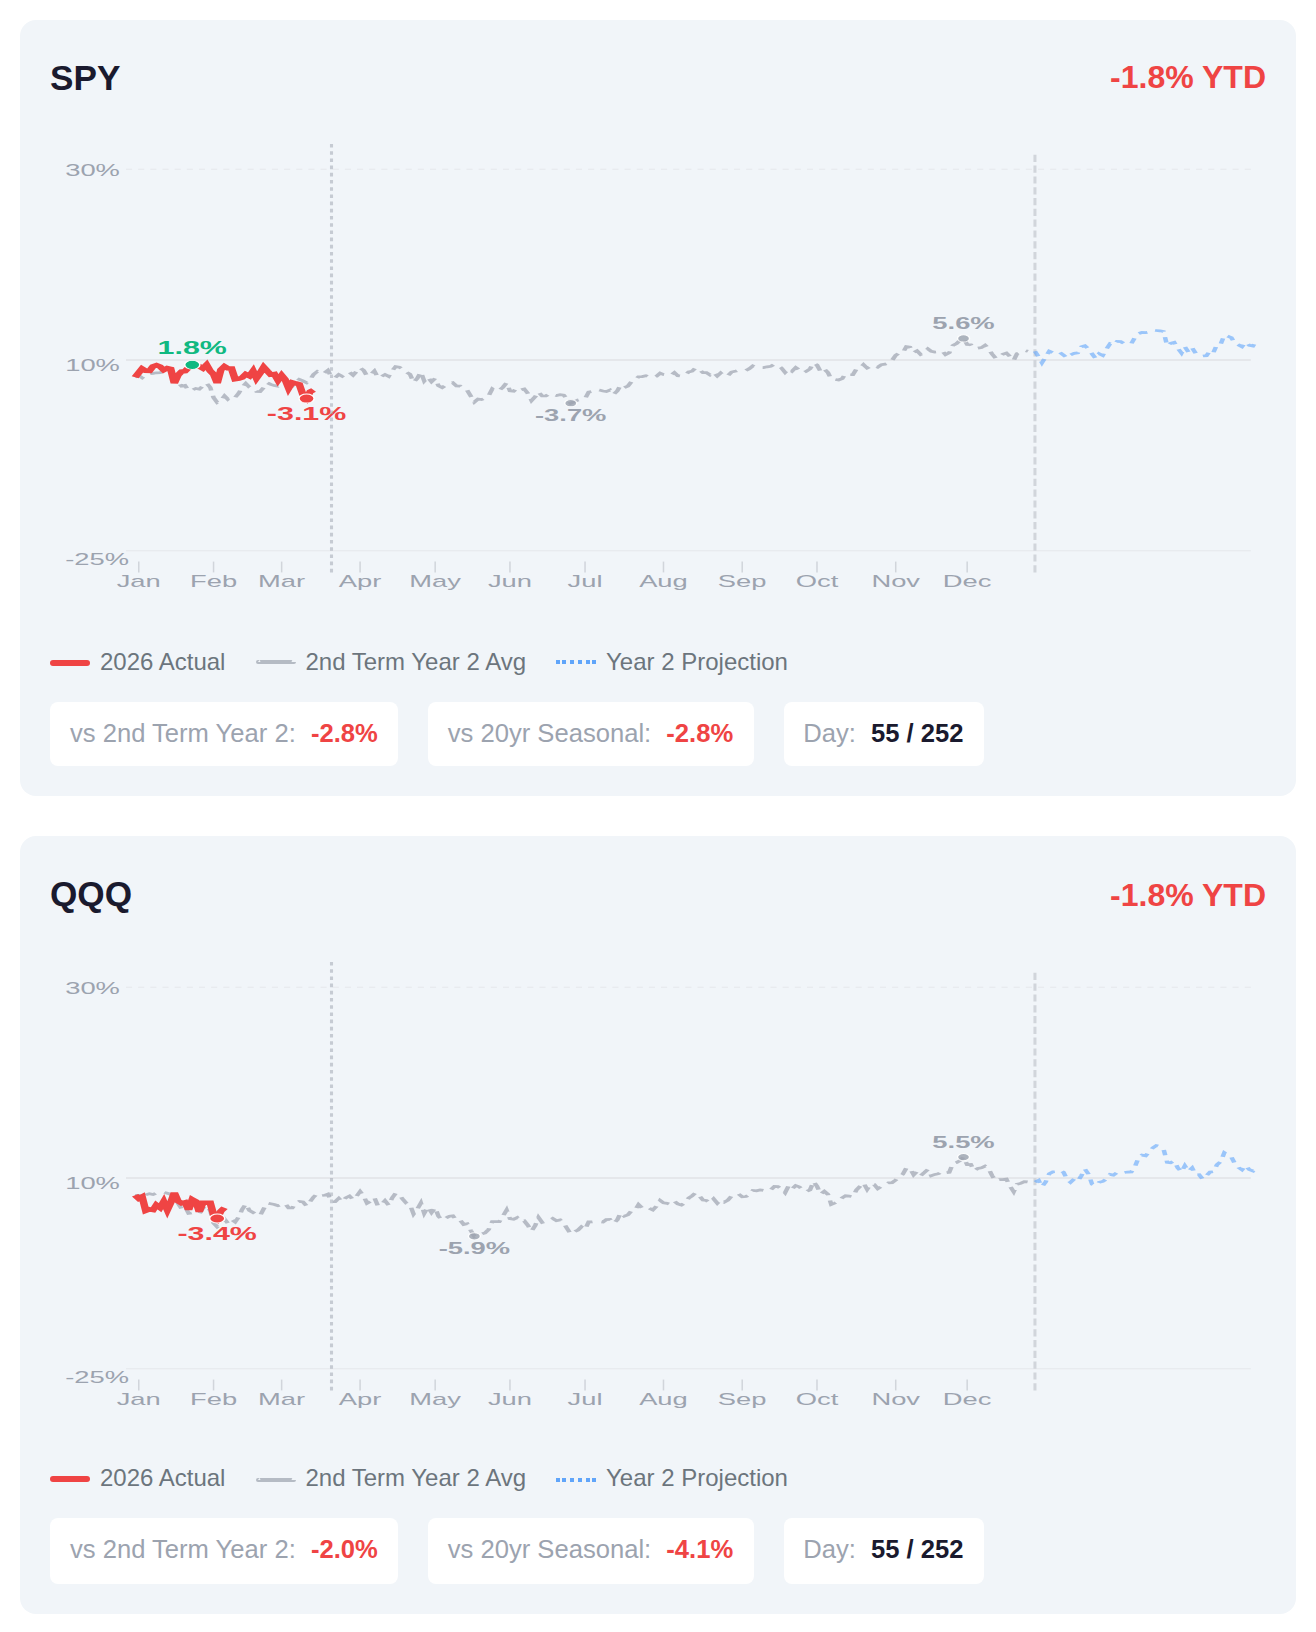
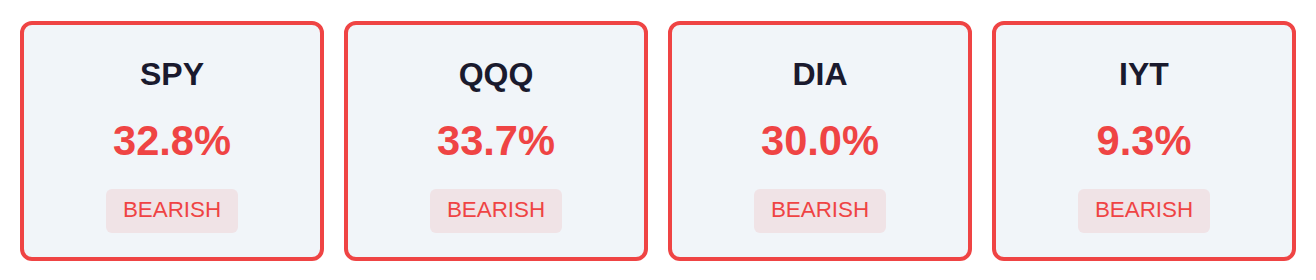
We're 55 trading days into Year 2 of Trump's second term, and both SPY and QQQ are running about 2.8% below where they typically sit at this point in the presidential cycle—with SPY down 1.8% year-to-date versus the historical Year 2 average gain of around 3.5% for the full year. The current underperformance is notable given that second-term Year 2s have historically added another 1.5% through mid-March, though markets don't always follow the script. If the historical pattern holds for the remainder of the year, we'd be looking at a catchup scenario from current levels, but it's worth noting that Year 2 tends to be the weakest year in the four-year presidential cycle anyway—so institutional positioning in the coming quarters will be telling.
📚 Jargon Buster
Terminal Rate
The peak interest rate everyone thinks the Fed will stop at. Like the top of a rollercoaster before the drop… or another loop.
The VIX declined 7.8% week-over-week to 23.51, remaining in elevated territory that suggests heightened uncertainty in equity markets, though the downward move indicates some fear subsided during the week. Meanwhile, the MOVE index measuring bond market volatility rose 2.5% to 14.83, staying at historically low levels that reflect relative calm in fixed income markets. This divergence shows equity traders pricing in notably more uncertainty than their bond market counterparts, with stock volatility elevated while Treasury volatility remains muted.

|| Market Sutra ||
"A bull market builds wealth; a bear market reveals wisdom."
— 2022 exposed who had risk frameworks and who only had bull-market luck
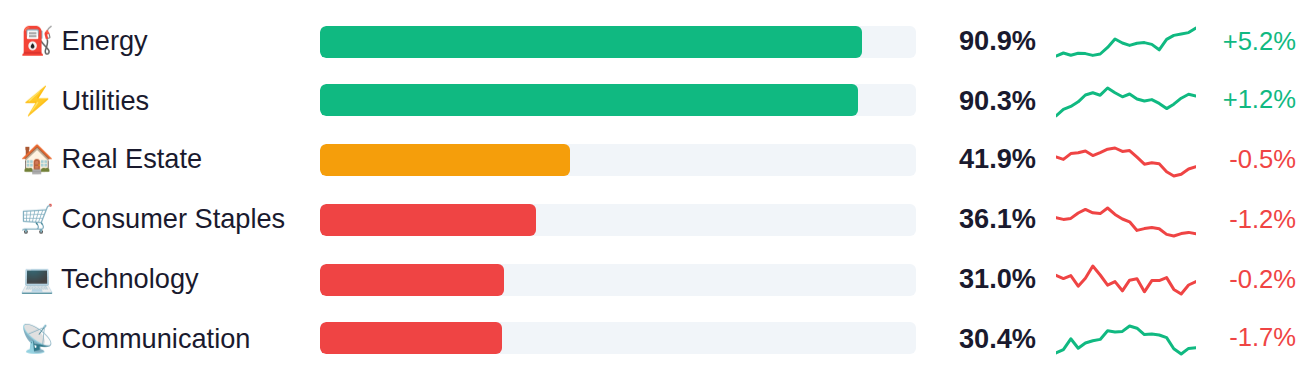
Market breadth remains narrow with only a third of SPY and QQQ constituents trading above their moving averages, while defensive sectors like Energy and Utilities show the strongest technical performance at 90%+ of their components in uptrends. A notable divergence has emerged between these traditionally defensive areas and growth-oriented sectors, with Semiconductors and Consumer Discretionary showing participation rates below 21% and transportation stocks particularly weak at just 9% breadth. The concentration in defensive sectors alongside weak cyclical participation typically characterizes a risk-off environment where investors rotate toward stability rather than growth.
As of March 11, Fed net liquidity stands at $6.65 trillion, up $17.4 billion week-over-week, indicating an expansion in system liquidity that historically correlates with supportive conditions for risk assets. The next H.4.1 release drops Thursday, March 19, which will show whether this liquidity injection trend continues or reverses.
Pending home sales rebounded sharply in February with a 1.8% monthly gain against expectations of a -0.5% decline, suggesting housing demand stabilized after January's drop, though crude oil inventories surged by 6.6 million barrels versus forecasts for a 0.6 million drawdown—a 7.2 million barrel miss that could pressure energy prices. Today's focus centers on the Federal Reserve's rate decision where markets expect a hold at 3.75%, though the real volatility will likely come from Chair Powell's press conference and the updated economic projections, while PPI data (expected at 0.3% versus last month's 0.5%) will provide the latest read on whether inflation pressures are continuing to moderate. Tomorrow's jobless claims (estimated at 215K) and the Philadelphia Fed Manufacturing Index, which is forecast to cool from 16.3 to 10.0, will test whether the recent uptick in the Economic Surprise Index—now at +2.1 from +0.5 a week ago—represents genuine economic momentum or just a temporary bounce.
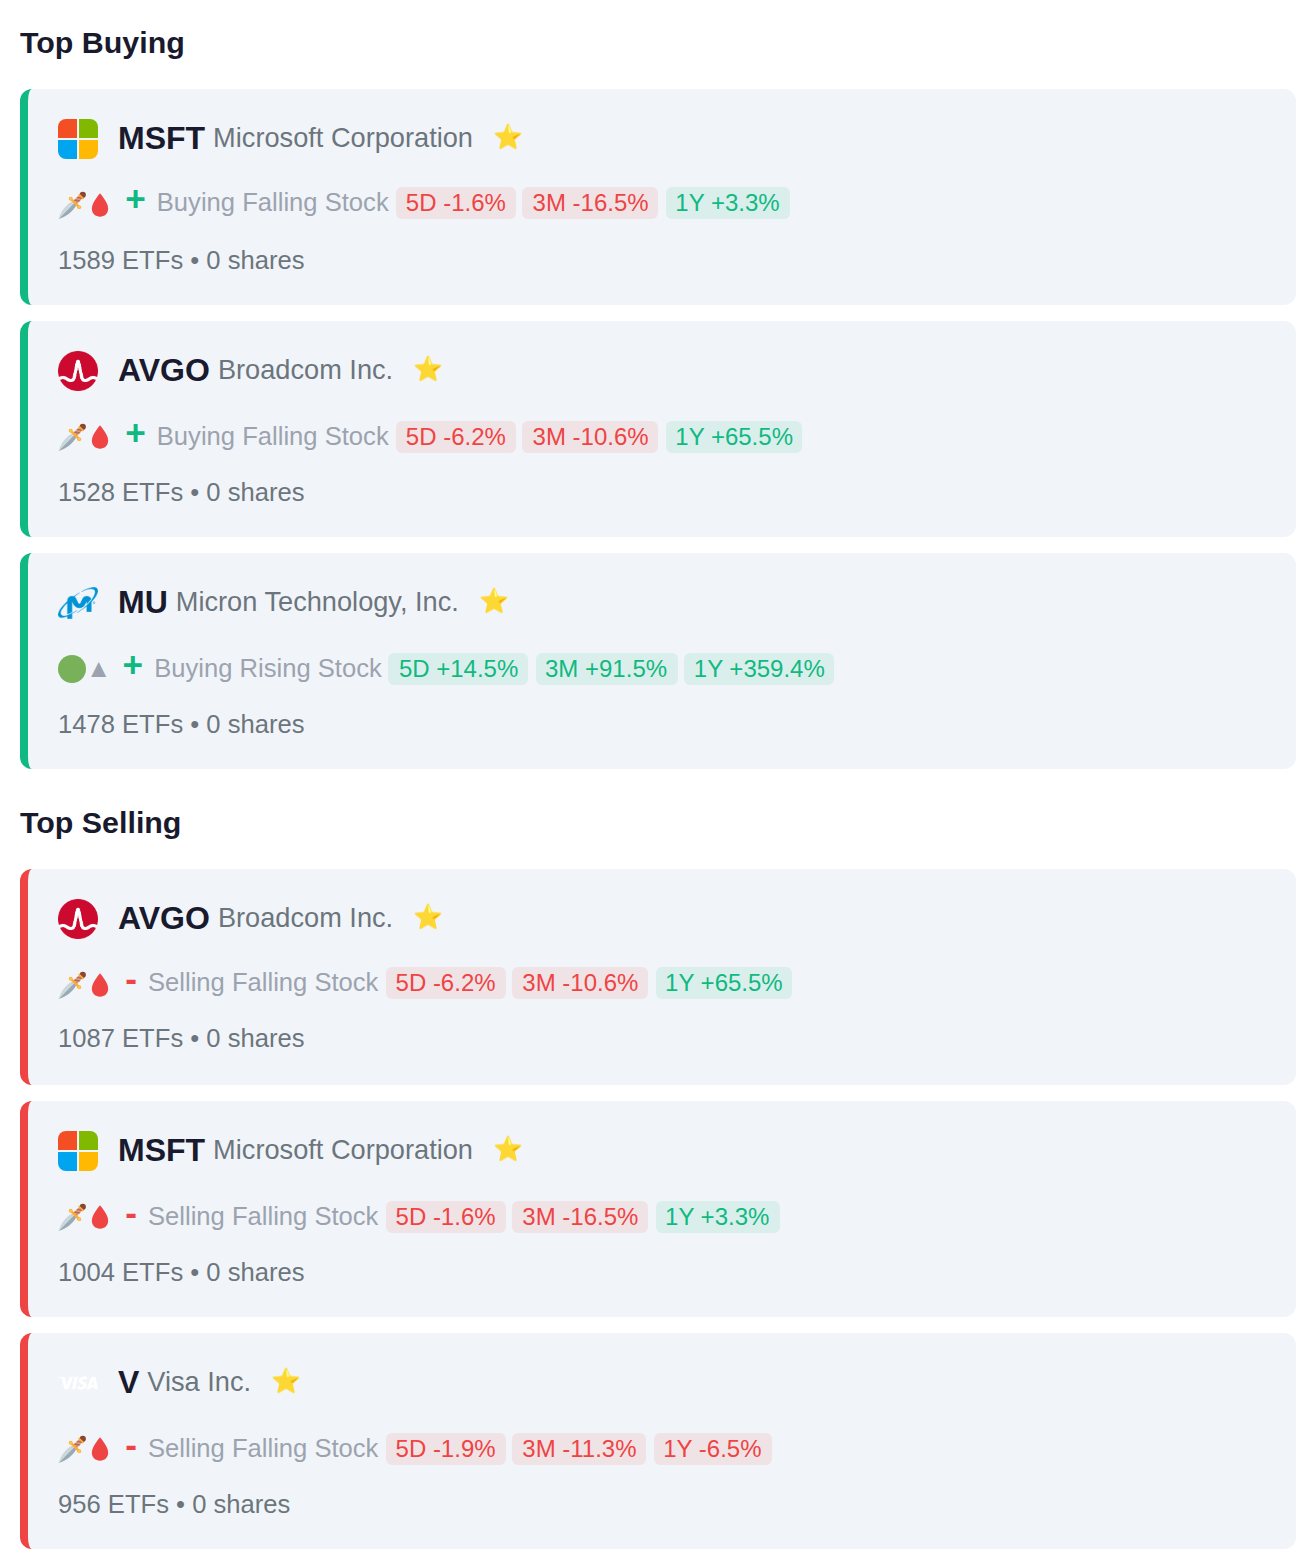
Exchange-traded funds demonstrated mixed conviction in the technology sector during the period, with 1,589 ETFs adding Microsoft positions while 1,004 reduced them, and particularly split action on Broadcom as 1,528 ETFs increased exposure while 1,087 decreased it. The flow data suggests institutional repositioning within semiconductor and software holdings, with memory chip maker Micron seeing net inflows across 1,478 ETFs while payment processor Visa experienced net outflows from 956 funds.
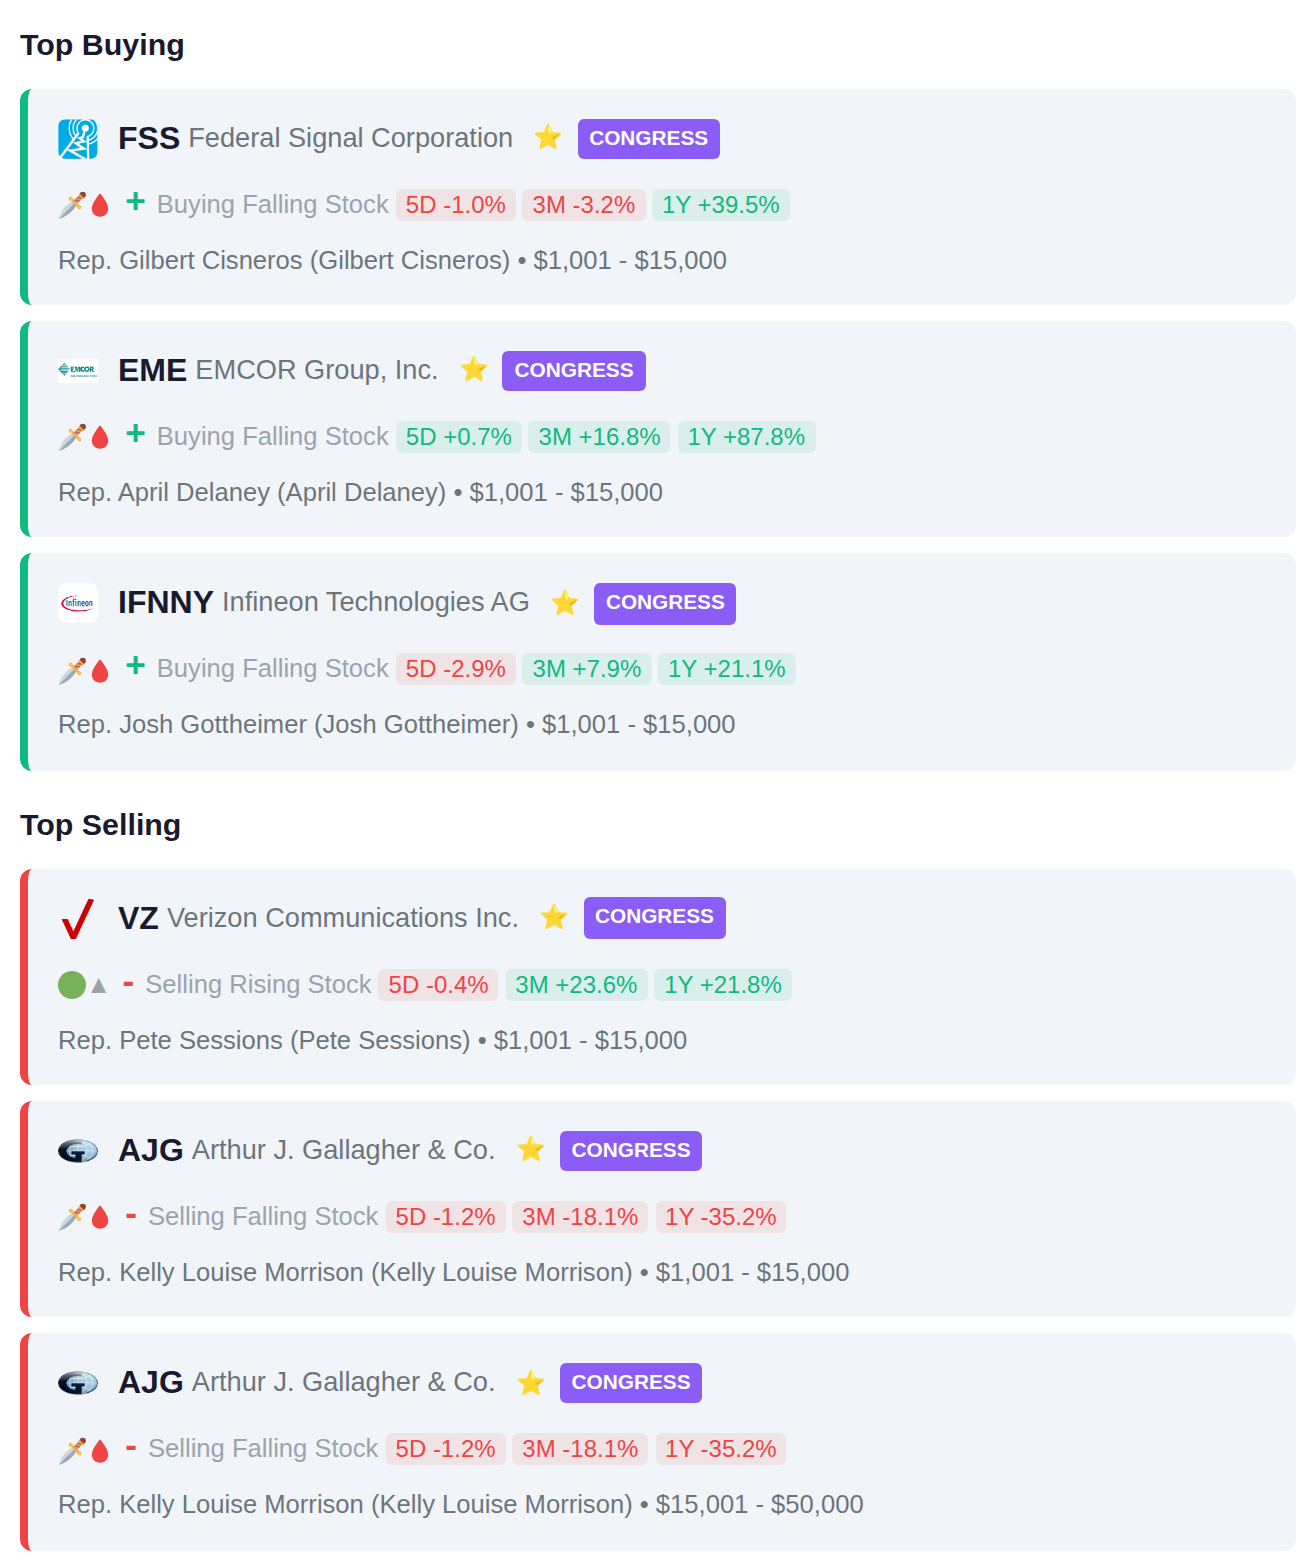
Congressional trading activity shows members adding positions in Federal Signal Corporation (FSS), EMCOR Group (EME), and Infineon Technologies (IFNNY), while divesting from Verizon Communications (VZ) and Arthur J. Gallagher & Co. (AJG), with Rep. Kelly Louise Morrison executing two separate sales of AJG. The activity reflects a mixed approach with purchases spanning industrial manufacturing and semiconductor sectors, while sales concentrated in telecommunications and insurance brokerage.
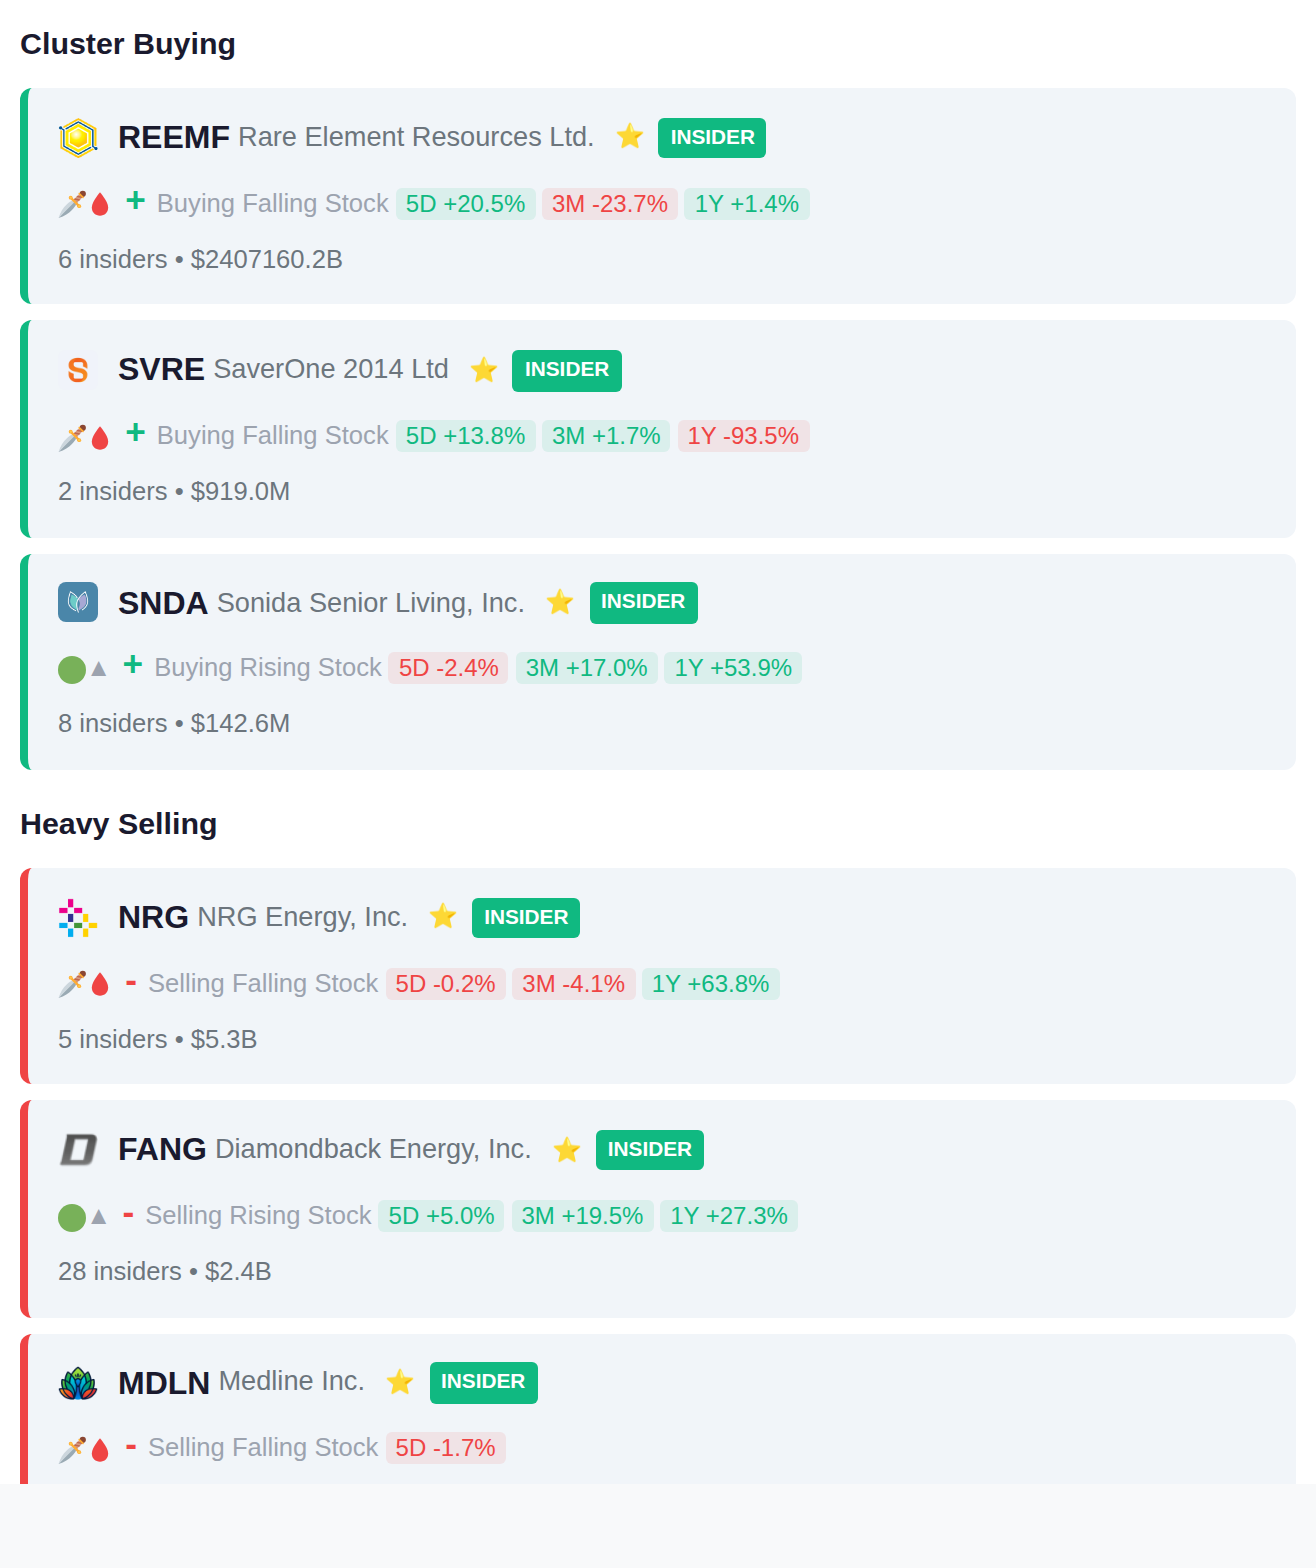
Multiple insiders at three companies executed purchase transactions this week, with SNDA showing the widest participation at 8 insiders, followed by REEMF at 6 insiders and SVRE at 2 insiders. On the distribution side, FANG led with 28 insiders selling $2.4B in shares, while NRG saw 5 insiders dispose of $5.3B and MDLN recorded 5 insiders selling $2.2B in holdings.
Today's earnings calendar features 352 reporting companies, with recent accumulation signals detected in 087010.KQ and 039030.KQ ahead of their reports. Yesterday's session saw significant declines in TME, which dropped 18.6%, alongside notable selling pressure in BOBS and ASO, down 18.5% and 16.8% respectively. Institutional distribution patterns have emerged in DSSA.JK and NKE.BA as 198 companies prepare to report tomorrow.