The Edge
Know What They Know
🐷 PIG ROAST
💬 Word on the Street
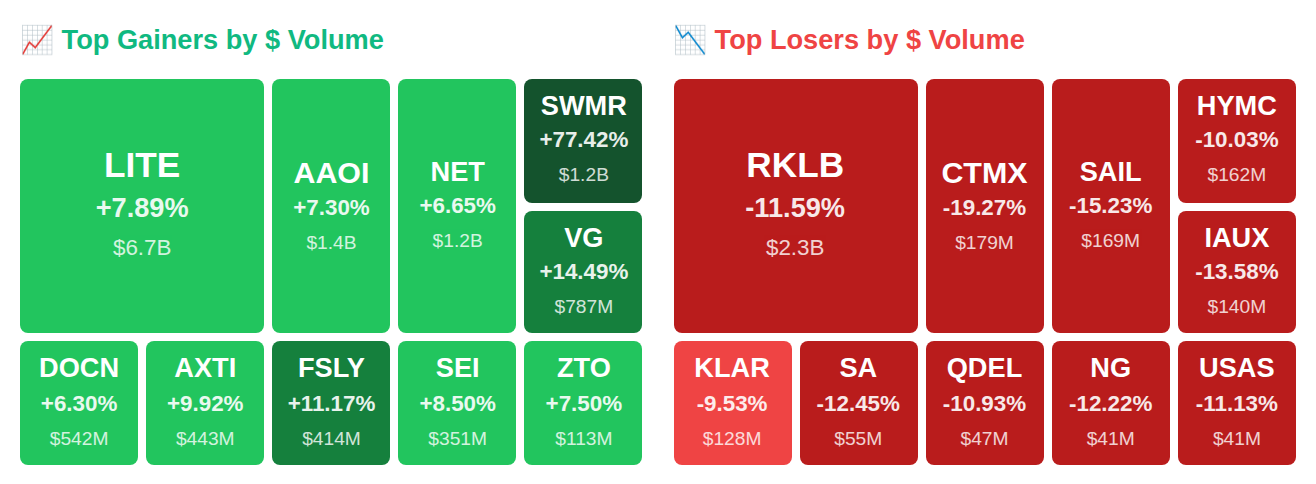
Rep. Cleo Fields (D-LA) quietly added Microsoft (MSFT) while five insiders at Medallia (MDLN) unloaded $2.2 billion—and that's just the warm-up before the real fireworks. AXT Inc (AXTI) Director Jesse Chen dumped 14,000 shares as the stock rocketed +9.9%, Fastly (FSLY) CEO cashed out $1.2 million right before an +11.2% surge, and Scotiabank analysts pumped Venture Global (VG) up +14.5% in after-hours trading while smart money recorded a $4.3 billion net outflow for the day. Here's what the insiders, Congress, and institutions actually did with their money today.
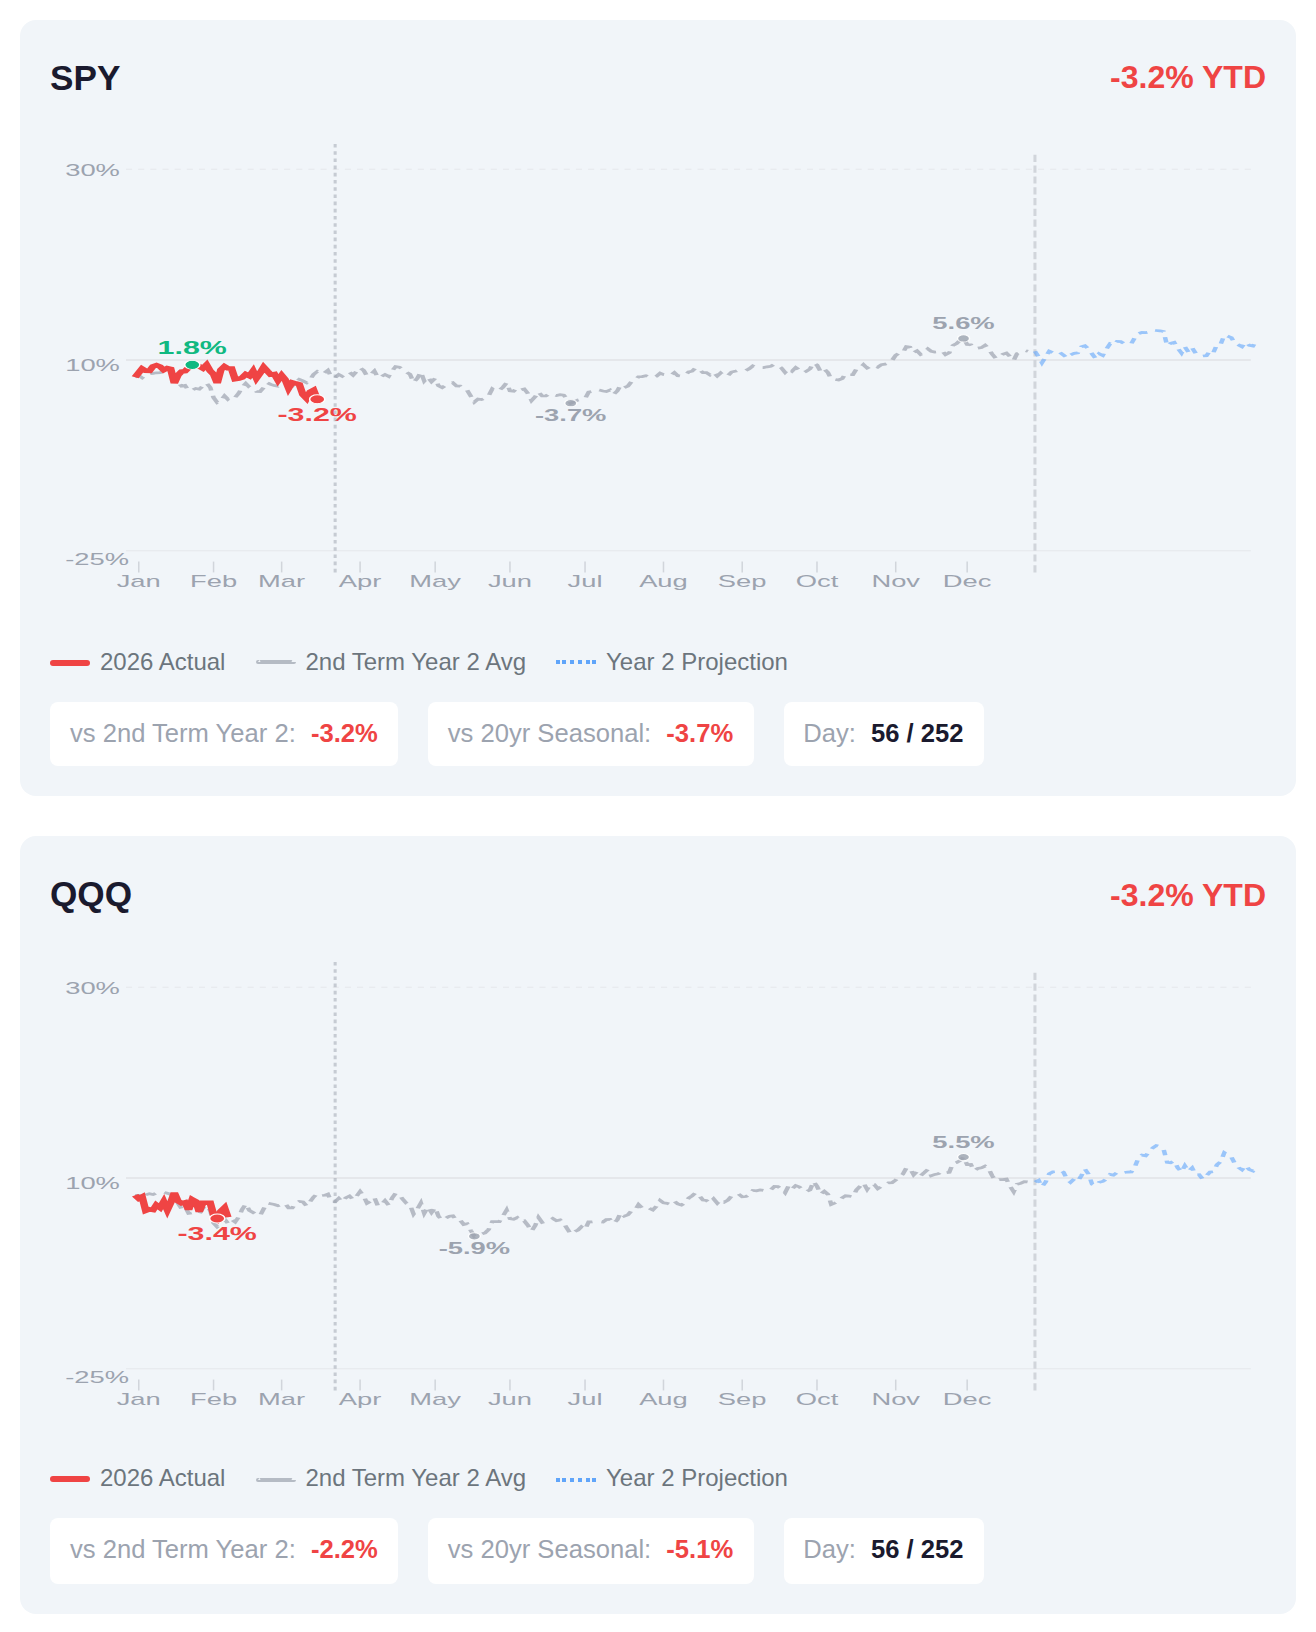
We're 56 days into Year 2 of Trump's second term, and both SPY and QQQ are running about 3% below where they typically sit at this point in the presidential cycle, with SPY also trailing its 20-year seasonal pattern by nearly 4%. History shows Year 2 of second terms has averaged around 3.5% full-year returns for SPY, and the typical pattern suggests another 1.5% gain materializes by mid-March as Q1 wraps up. The current underperformance relative to historical norms puts markets in a position where they'd need to outpace typical seasonal strength in the back half of Q1 and beyond to converge with the historical average—something institutional investors will be watching closely as they position portfolios for the remainder of the cycle.
📚 Jargon Buster
Soft Landing
The Fed raising rates without killing the economy. Unicorn-level rare. Everyone talks about it, nobody’s seen it sober.
Equity market volatility declined substantially over the past week, with the VIX falling 10.3% to 22.37, though it remains in elevated territory above the 20 level that typically signals heightened investor concern. Meanwhile, bond market volatility moved in the opposite direction, as the MOVE index climbed 7.7% to 15.09, remaining at historically low levels. This divergence presents a mixed picture where equity traders are pricing in moderately elevated uncertainty while fixed income markets continue to reflect relative calm.

|| Market Sutra ||
"The market is never fair, only consistent."
— Growth stocks with no earnings were rewarded for a decade because liquidity favored them
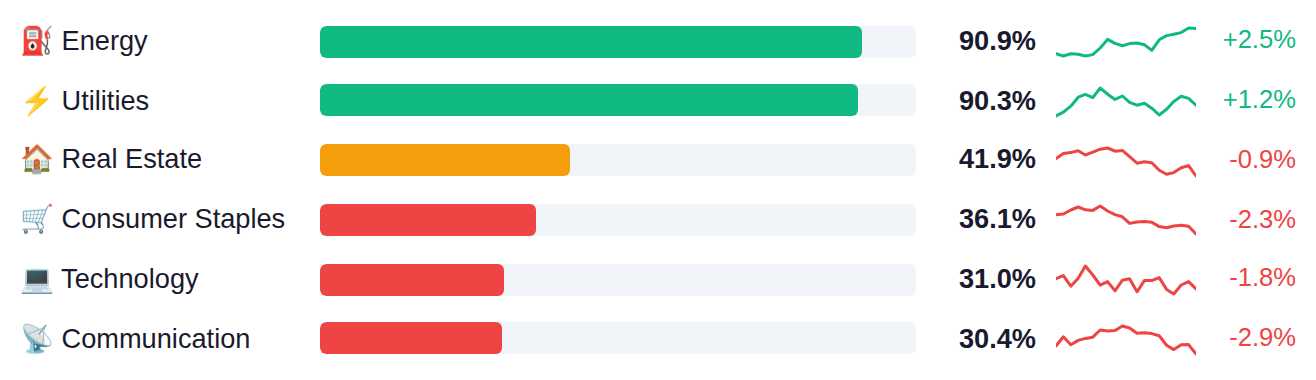
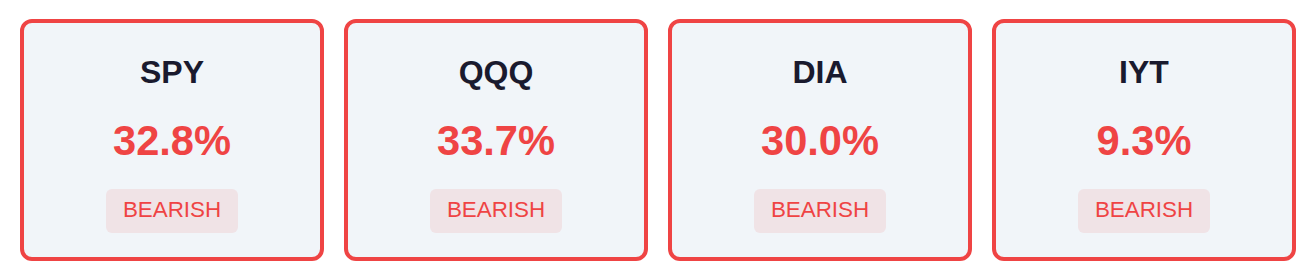
Market breadth remains narrow across major indices, with only about one-third of SPY and QQQ components advancing while IYT shows particularly weak participation at just 9%. The performance dispersion reveals a pronounced defensive tilt, as Energy and Utilities sectors demonstrate strength above 90% while growth-oriented areas including Semiconductors and Consumer Discretionary lag significantly below 25%. This divergence between defensive sector leadership and weak participation in economically sensitive areas suggests investors are positioning for increased uncertainty rather than broad-based expansion.
As of March 11, Fed net liquidity stands at $6.65T, up $17.4B week-over-week, indicating an expansion in system-wide liquidity that historically correlates with supportive conditions for risk assets. The next H.4.1 release drops Thursday, March 19, which will show whether this liquidity injection trend continues or reverses.
Yesterday's producer price data delivered an inflationary shock, with both headline PPI and core PPI jumping 0.7% and 0.5% respectively against 0.3% estimates—the kind of double-miss that complicates the Fed's decision-making even as they held rates steady at 3.75% as expected. The more concerning signal came from Treasury International Capital flows, which collapsed to $15.5 billion in January from $96.5 billion prior and missed the $71.6 billion estimate by a wide margin, raising questions about foreign appetite for U.S. debt at a time when deficits remain elevated. Today's focus shifts to labor market resilience with initial jobless claims expected at 215,000 (up modestly from 213,000) and the Philadelphia Fed Manufacturing Index forecast to cool to 10.0 from 16.3, while tomorrow's CFTC positioning data will reveal whether speculators maintained their net short stance on the S&P 500 at -134,500 contracts amid this week's volatility.
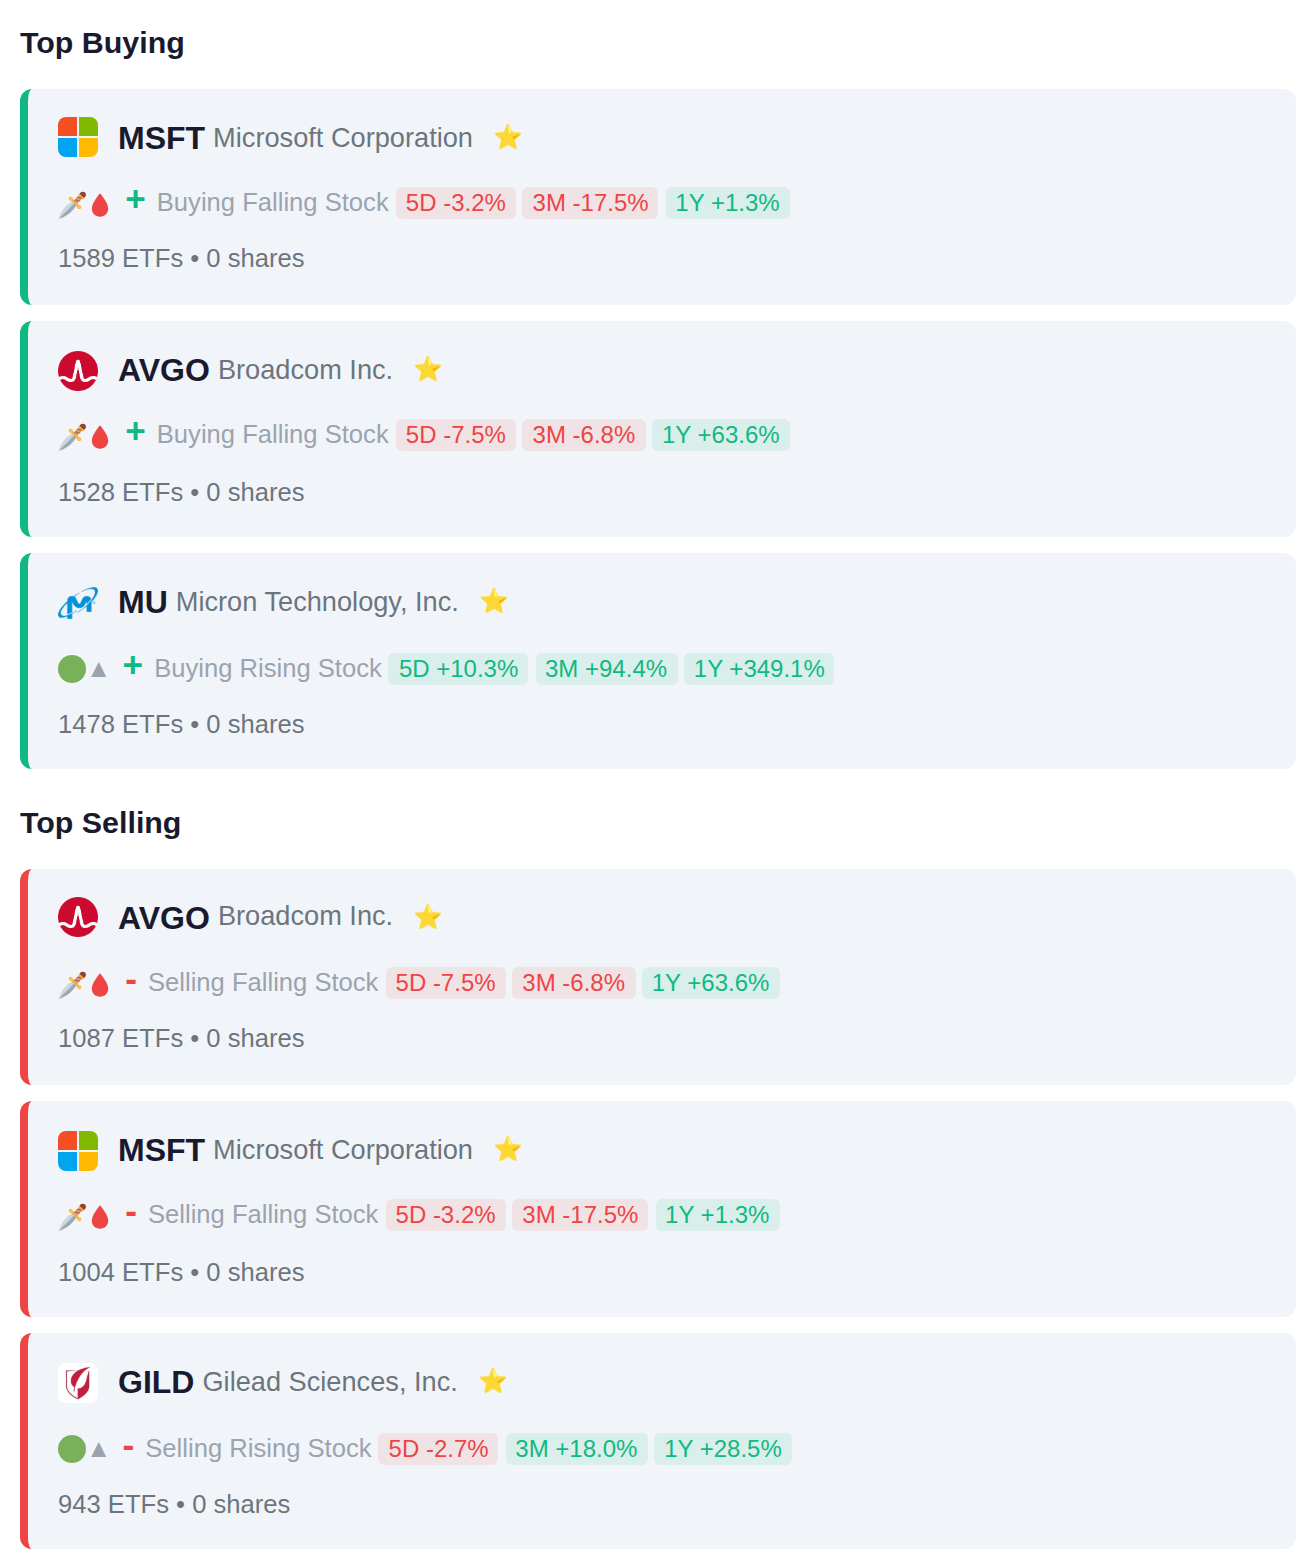
Exchange-traded funds showed mixed positioning in technology during the period, with 1,589 ETFs adding Microsoft and 1,478 adding Micron in semiconductors, while 1,087 ETFs simultaneously reduced Broadcom despite 1,528 adding positions. The split activity—10 ETFs net adding and 10 net removing across top movers—suggests institutional rotation within tech rather than broad sector exit, with healthcare name Gilead seeing 943 ETFs trim positions.
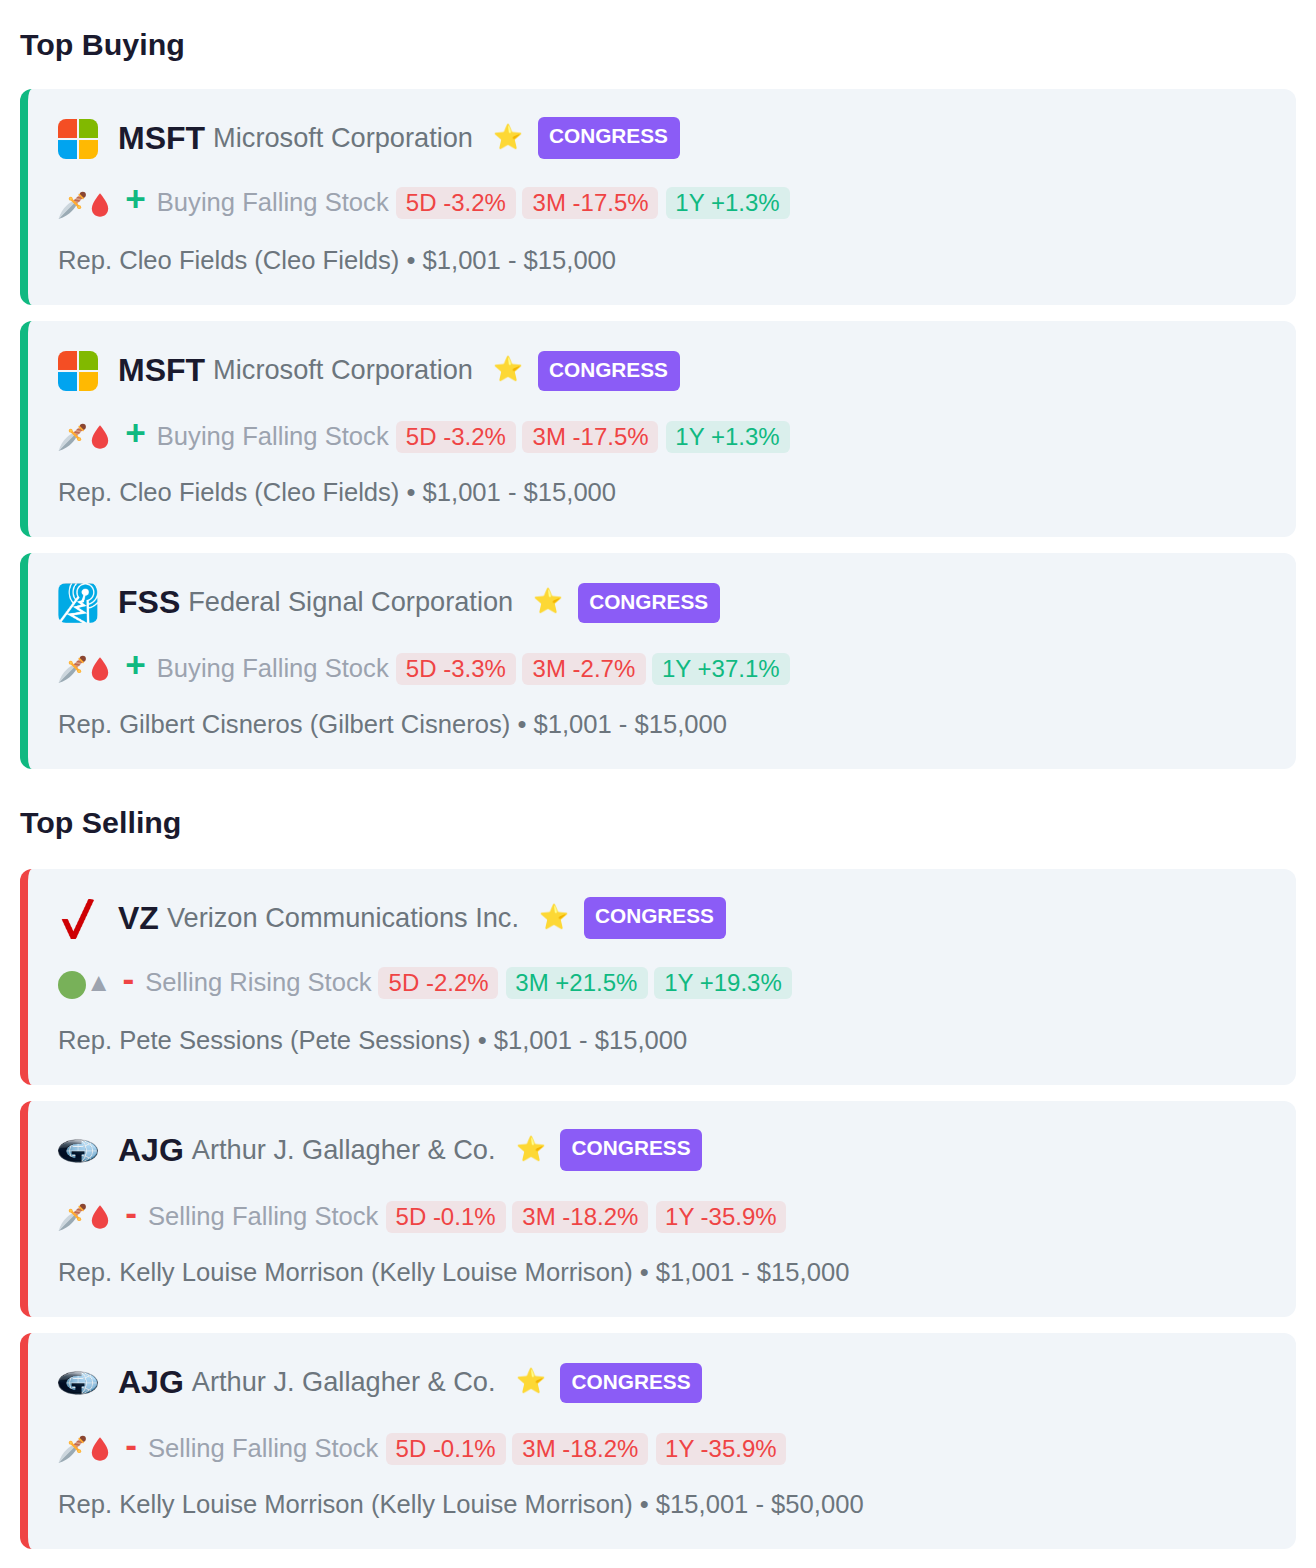
Rep. Cleo Fields purchased Microsoft (MSFT) in two separate transactions, while Rep. Gilbert Cisneros added Federal Signal Corporation (FSS) to their holdings. On the selling side, Rep. Pete Sessions exited a position in Verizon (VZ), and Rep. Kelly Louise Morrison sold Arthur J. Gallagher & Co. (AJG) across two transactions, with the notable pattern being multiple trades of the same stock by individual representatives.
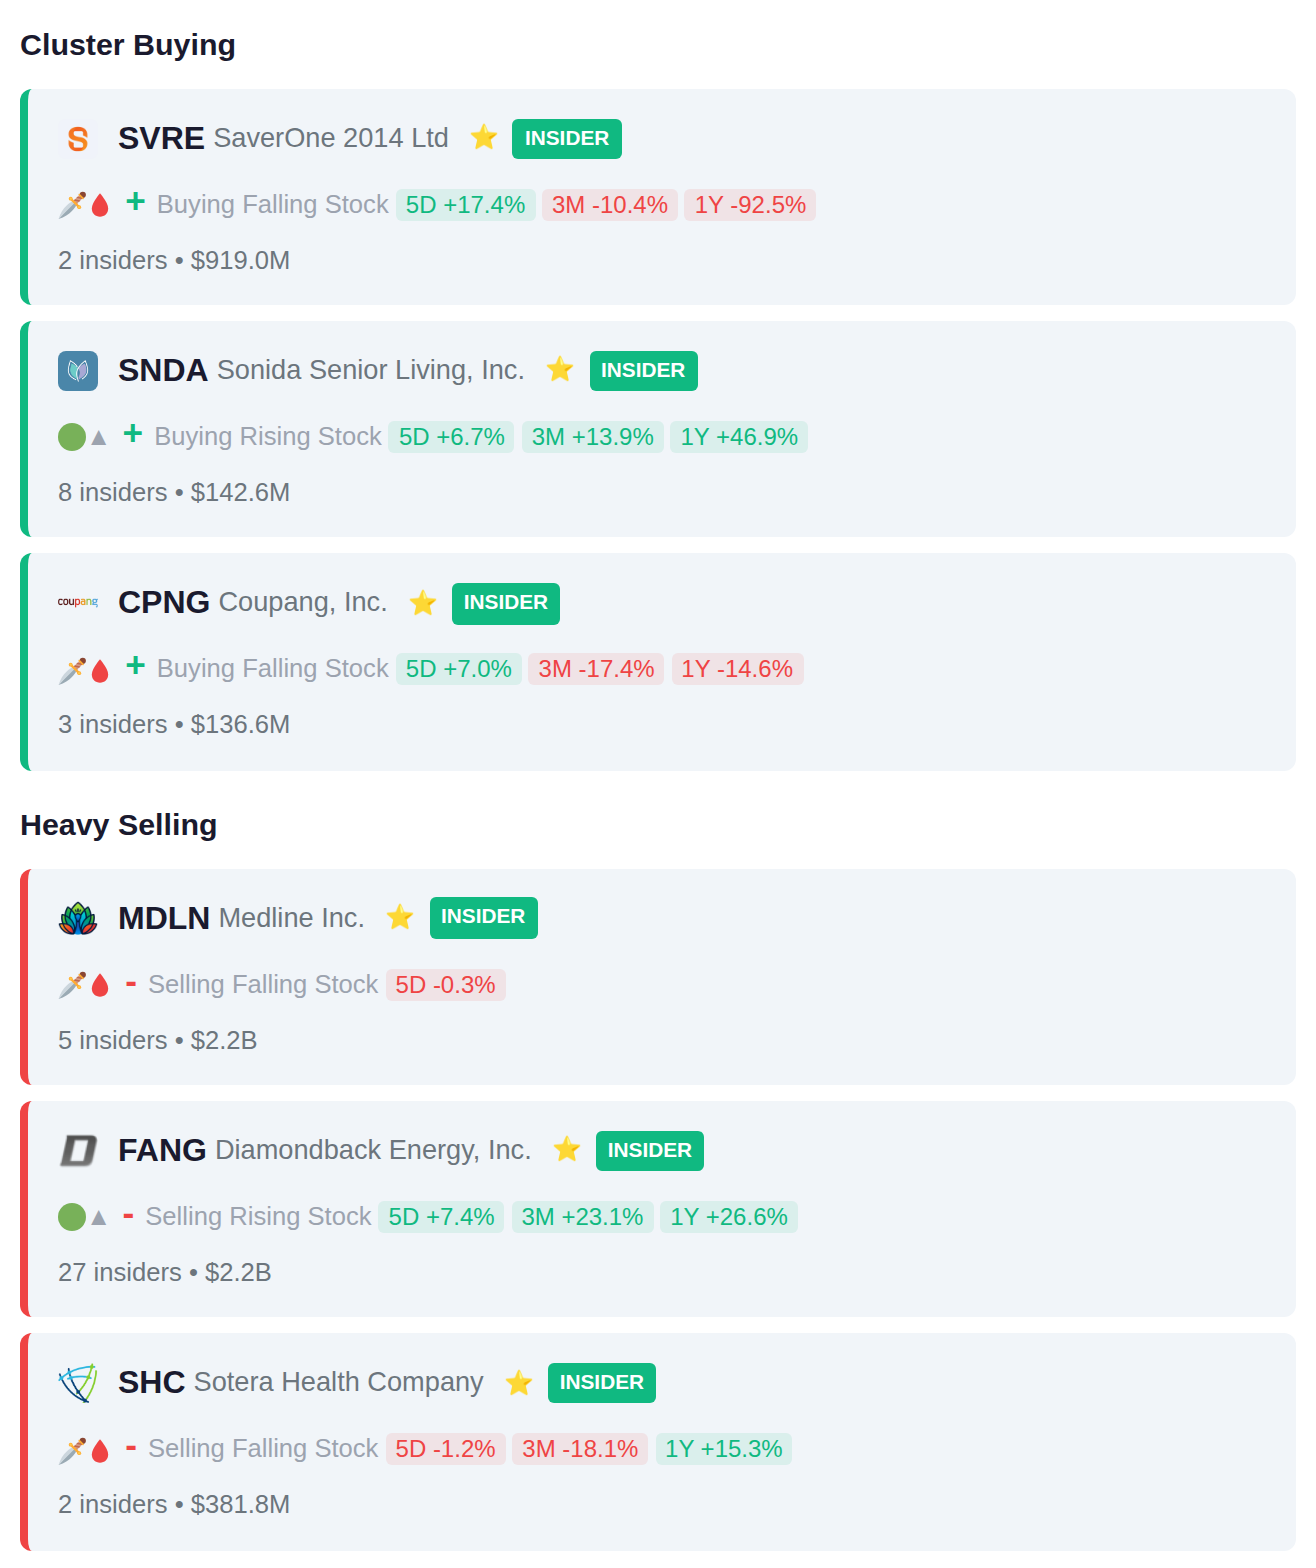
Insider activity showed balanced signals this week with 15 accumulation and 15 distribution events, highlighted by concentrated selling at MDLN where 5 insiders sold $2.2B and FANG where 27 insiders sold $2.2B. On the accumulation side, SNDA recorded purchases or awards from 8 insiders, while CPNG and SVRE each saw 3 and 2 insiders adding positions respectively.
Yesterday's session saw significant moves with SAIL declining 21.0%, OEZVY dropping 18.0%, while HTFL surged 14.7%. Today's slate of 353 companies reporting earnings includes ELSA.JK and VAPORES.SN showing recent accumulation patterns, while EMTK.JK and ARTO.JK have exhibited distribution signals ahead of their results. Tomorrow's calendar lightens considerably with 32 companies scheduled to report.