The Edge
Know What They Know
🐷 PIG ROAST
💬 Word on the Street
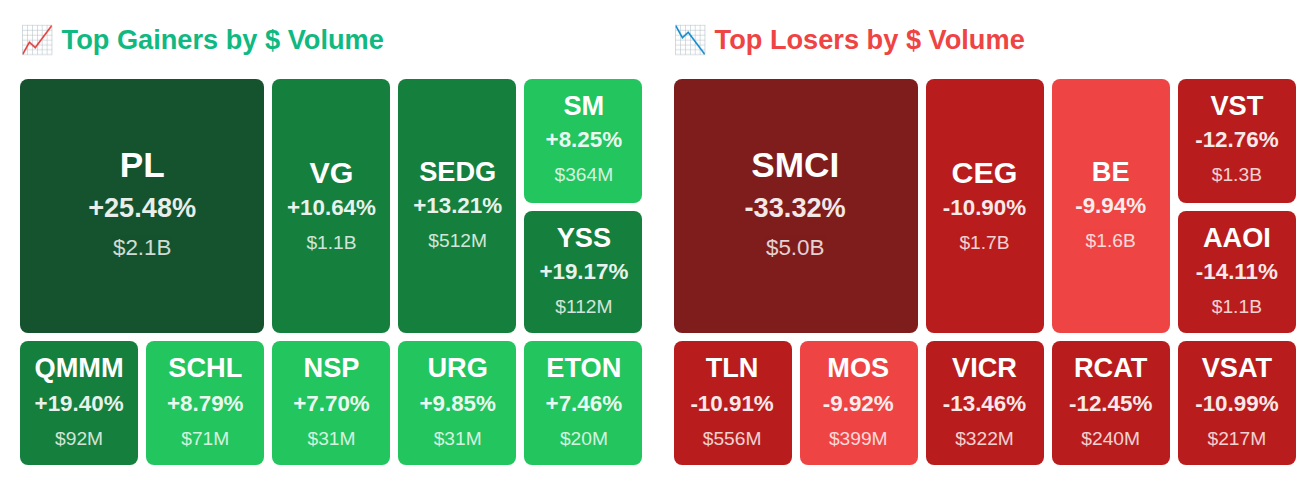
The VIX just dropped 11.8% to 24.1 while Rep. Cleo Fields (D-LA) quietly picked up Microsoft Corporation (MSFT) shares worth up to $15,000—and that's the *calm* part of today's action. After hours, Planet Labs PBC (PL) rocketed 25.5% to $33.83 as Wall Street finally noticed its $900 million backlog, SolarEdge Technologies Inc. (SEDG) blasted to a fresh 1-year high at $51.69 on analyst upgrades, and insiders at Wheeler Real Estate Investment Trust Inc. (WHLR) dumped a staggering $31.5 billion in what might be one of the largest insider sell-offs we've tracked. Here's what smart money is doing today.
📚 Jargon Buster
Disinflation
Prices still rising, but slower. Like the hookers raised prices last year but only a little this year.
The VIX stands at 24.06, remaining in elevated territory despite dropping 11.8% over the past week, suggesting equity market fear has moderated but hasn't returned to normal levels. Meanwhile, the MOVE index rose 5.8% to 14.01, which remains historically low and indicates bond market participants are pricing in minimal interest rate volatility. This divergence shows equity investors maintaining heightened caution while fixed income markets reflect relative calm about the path of rates.

|| Market Sutra ||
"Mispriced risk is more dangerous than visible risk."
— 2008 mortgage bonds were AAA-rated but structurally toxic
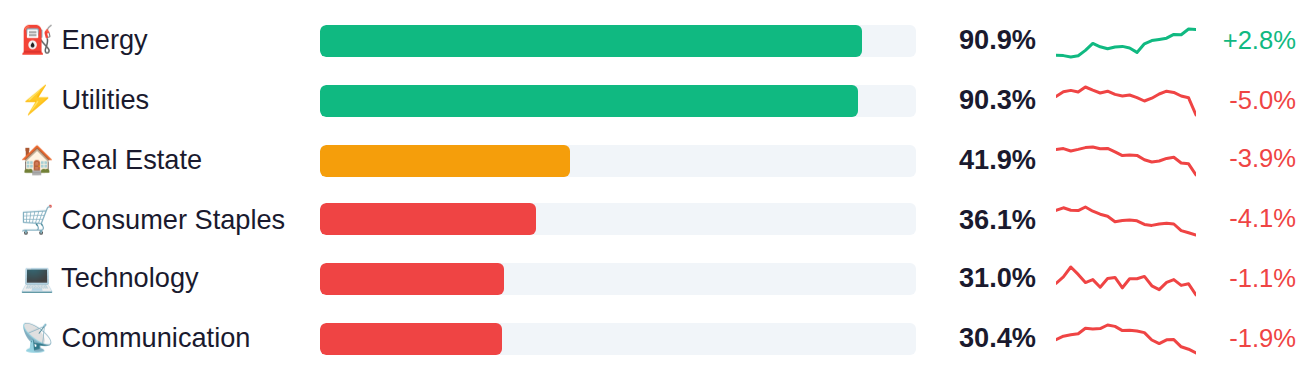
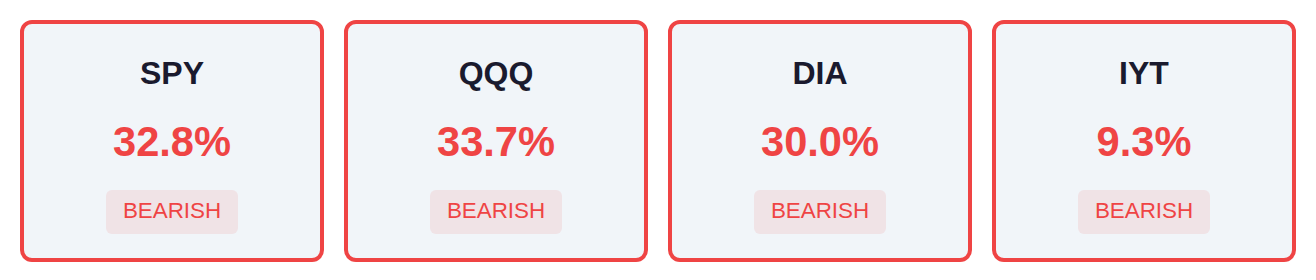
Market breadth remains narrow across major indices, with roughly one-third of SPY and QQQ components advancing while IYT shows particularly weak participation at just 9%. A clear defensive rotation has emerged, as Energy and Utilities lead with over 90% of their constituents advancing, contrasting sharply with growth-sensitive areas where Consumer Discretionary, Semiconductors, and Financials are seeing participation rates below 21%. This divergence between defensive sector strength and cyclical weakness typically characterizes periods when market participants are repositioning for slower economic conditions.
As of March 18, the Fed's net liquidity stands at $6.66 trillion, up $9.6 billion from the prior week, indicating a modest expansion in system liquidity that historically correlates with supportive conditions for risk assets. The next H.4.1 report releases Thursday, March 26, which will show whether this liquidity injection trend continues or reverses.
Yesterday's CFTC positioning data showed speculators trimmed exposure across most asset classes, with crude oil net longs declining from 228.0K to 218.7K contracts and gold positions slipping from 163.1K to 159.9K, while S&P 500 net shorts narrowed modestly from -134.5K to -113.1K, suggesting some tactical covering as equities stabilized. Today's focus turns to the Atlanta Fed's GDPNow update, which has held steady at 2.3% for Q1, and the Chicago Fed Activity Index for February, expected to rise to 0.27 from 0.18. Tomorrow brings the critical March PMI flash readings where consensus anticipates notable softening—the composite index is forecast to drop to 50.5 from 51.9, manufacturing to 50.2 from 51.6, and services to 50.4 from 51.7—which would mark a sharp deceleration in private sector activity and potentially signal contraction if the 50-level threshold is breached.
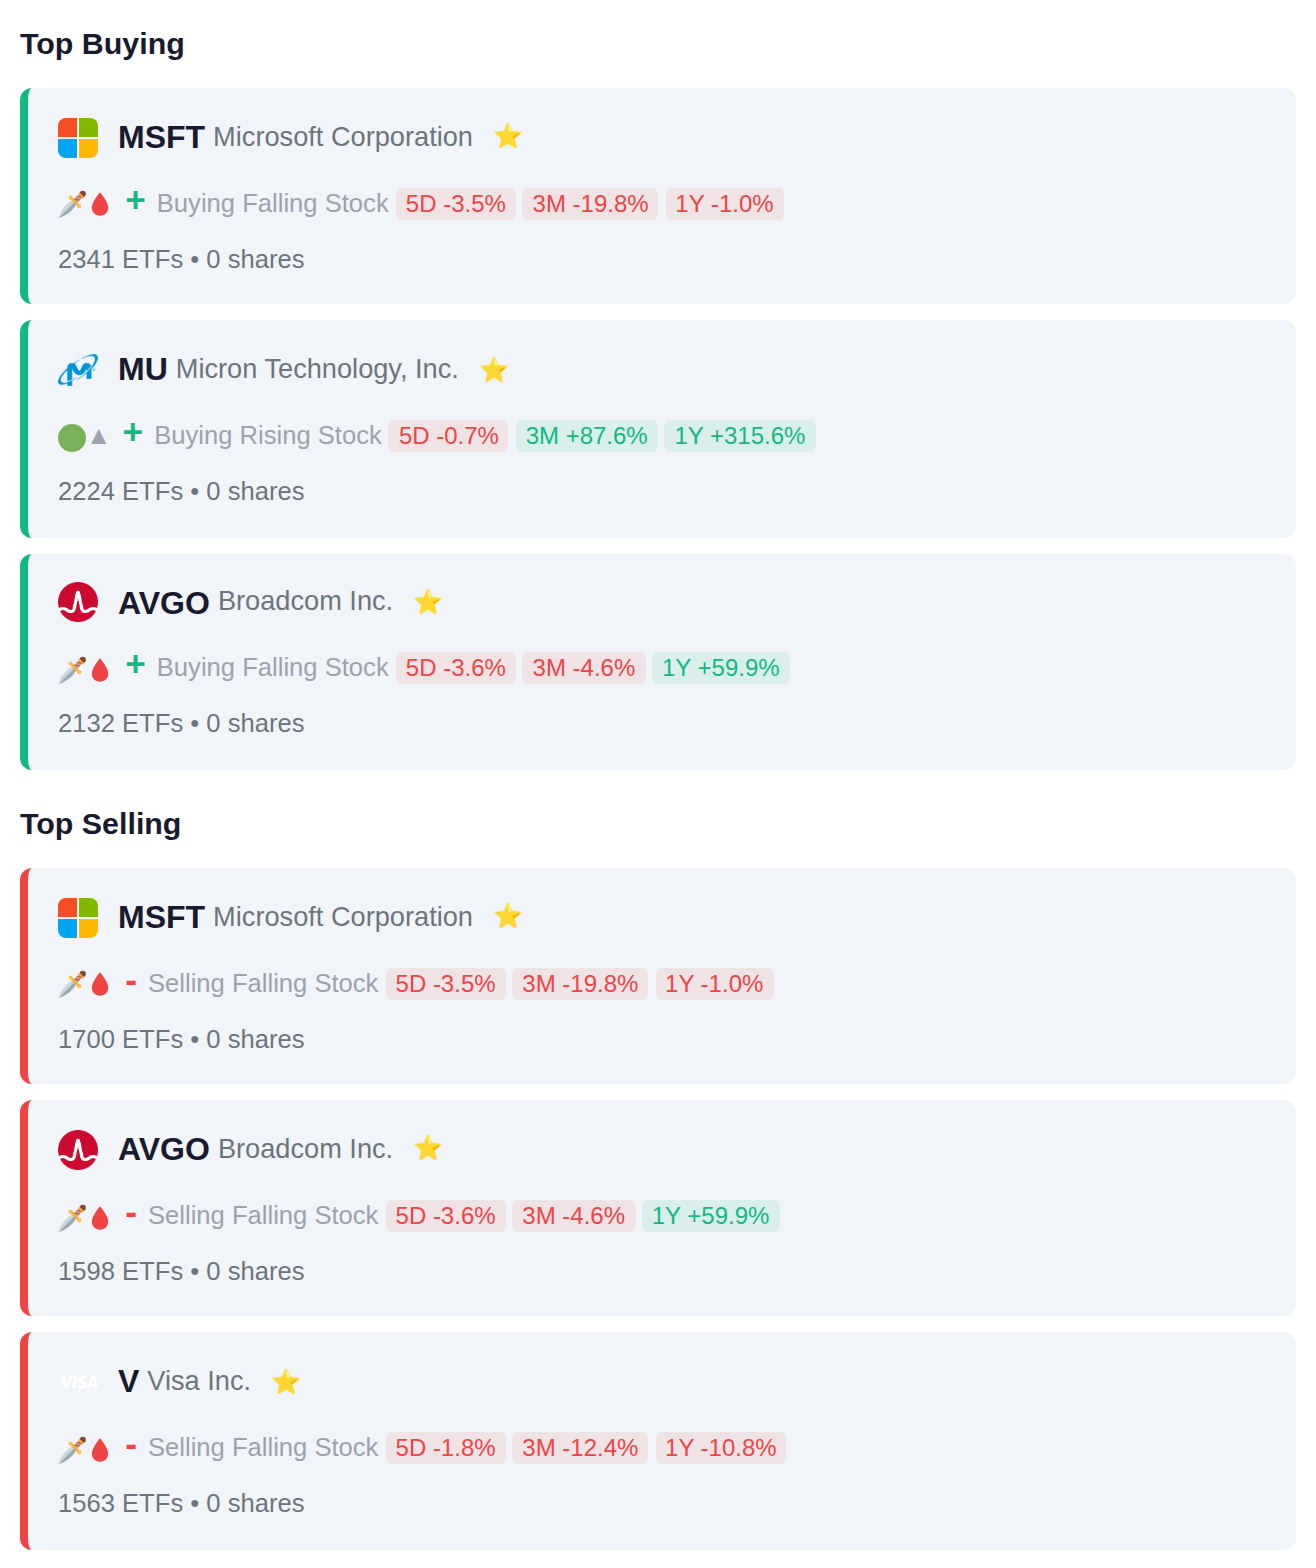
Exchange-traded funds showed mixed positioning in technology during the latest reporting period, with 2,341 ETFs adding Microsoft positions while 1,700 reduced them, and similar split activity in Broadcom (2,132 adding vs 1,598 removing). The flow data indicates institutional repositioning within mega-cap tech and semiconductors, as Micron attracted 2,224 ETFs adding exposure while payment processor Visa saw 1,563 ETFs trimming positions.
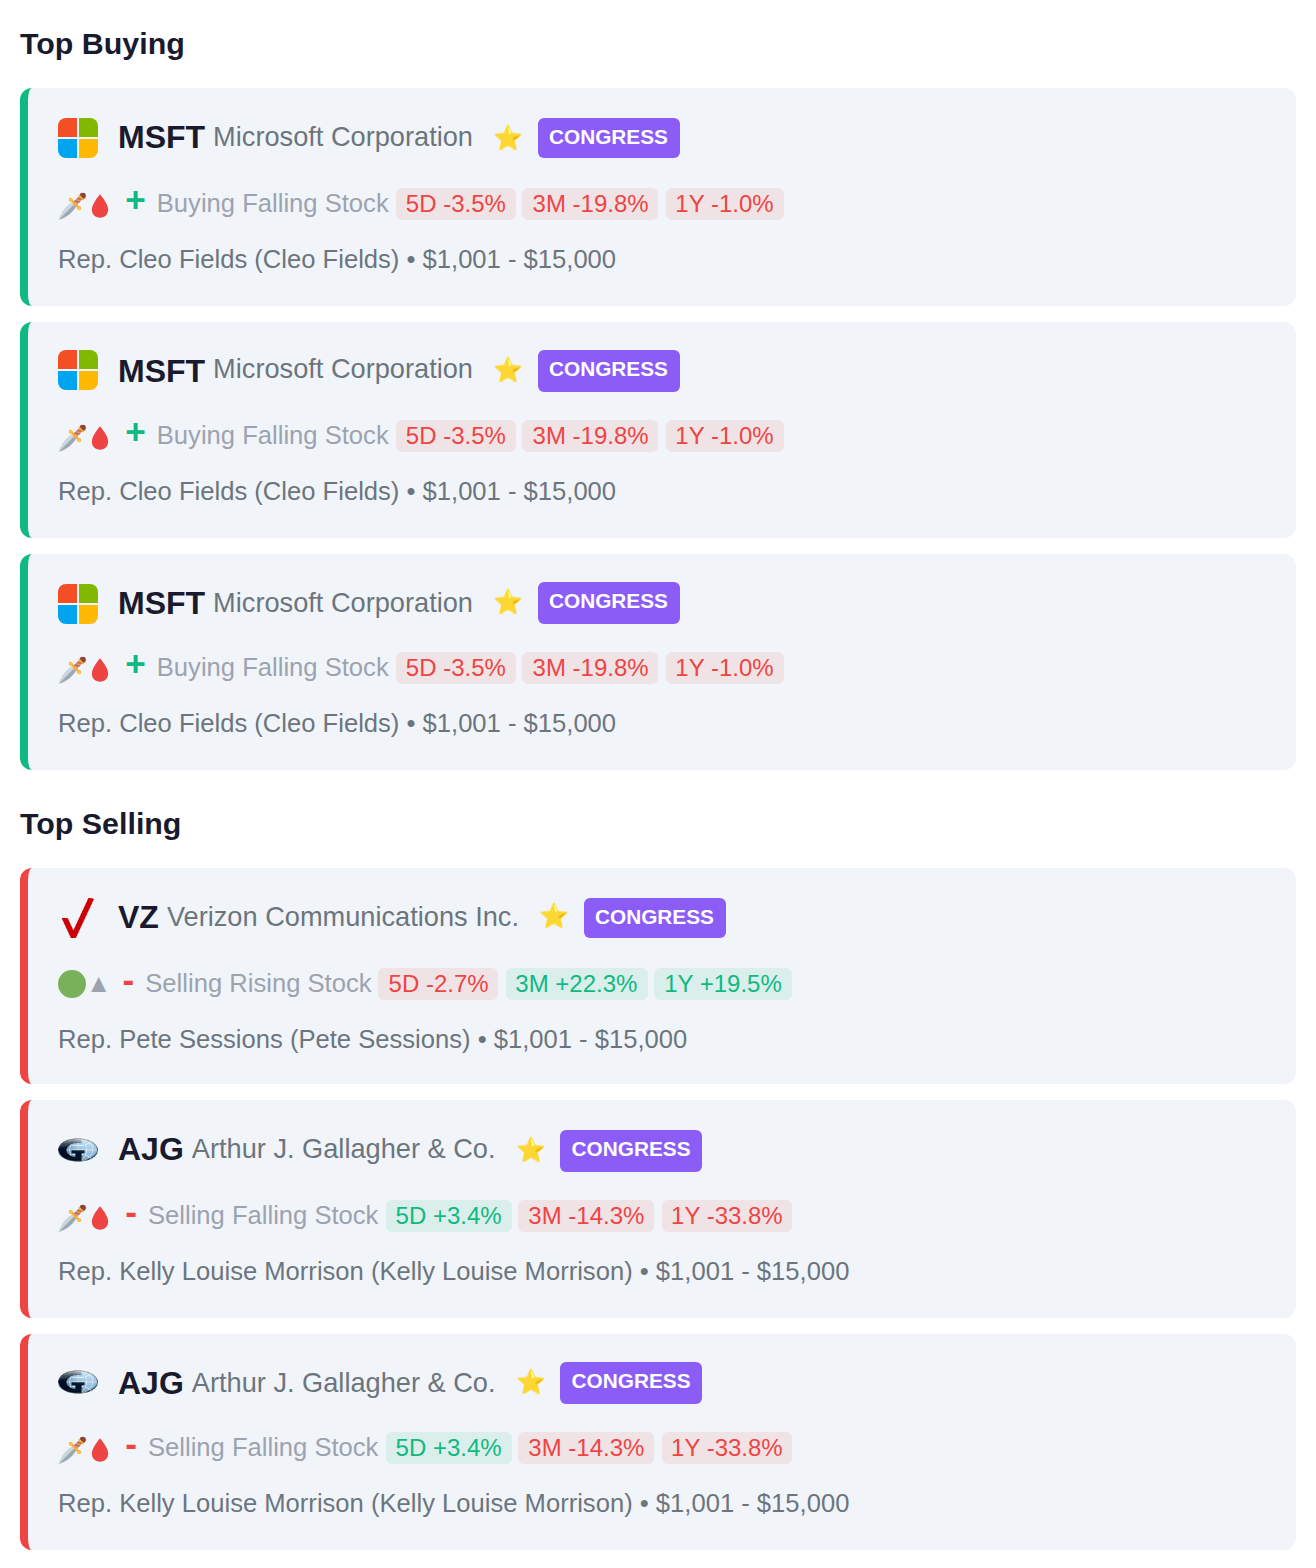
Rep. Cleo Fields executed three separate purchases of Microsoft (MSFT) shares, while Rep. Pete Sessions sold Verizon (VZ) and Rep. Kelly Louise Morrison made two sales of Arthur J. Gallagher & Co. (AJG). The trading activity shows concentrated buying in big tech and selling in telecommunications and insurance brokerage sectors by these members of Congress.
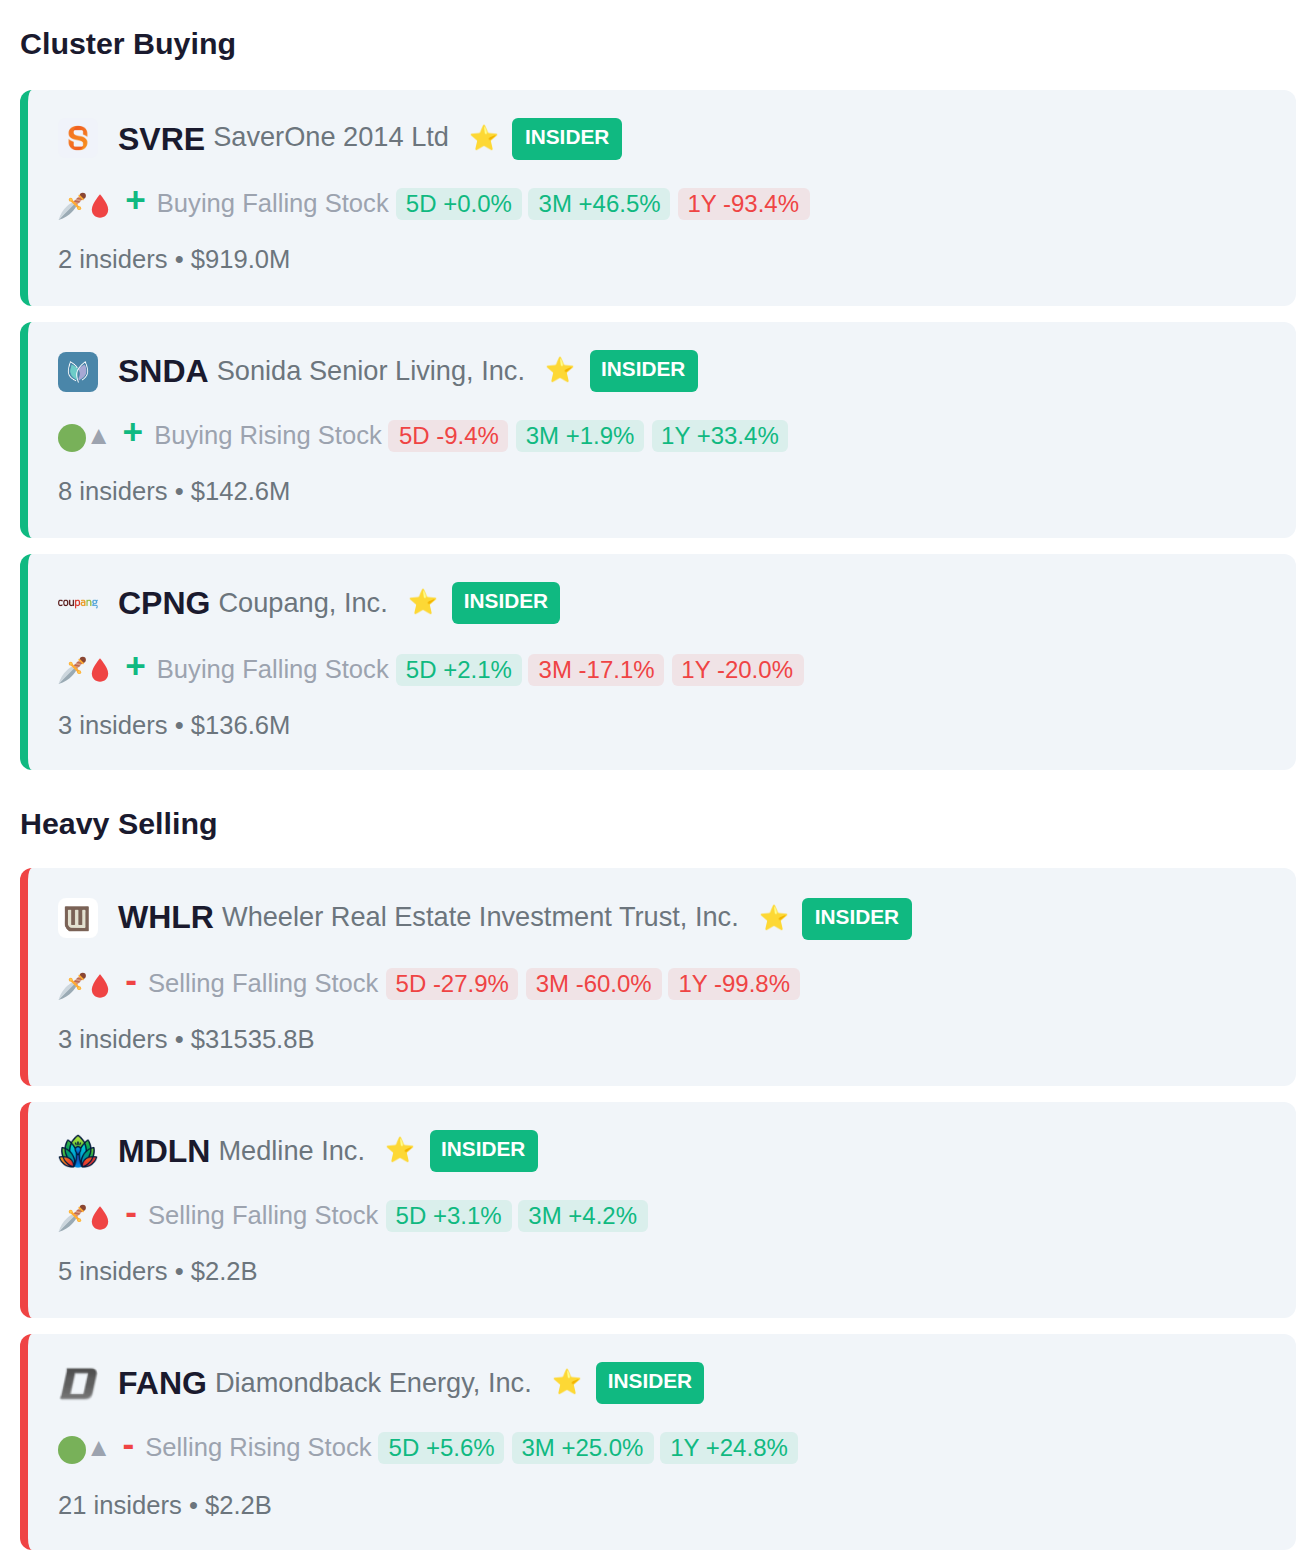
Recent insider activity shows concentrated selling at FANG with 21 insiders reducing positions totaling $2.2B, MDLN with 5 insiders selling $2.2B, and WHLR with 3 insiders divesting $31.5B. On the purchasing side, SNDA recorded 8 insiders adding positions, while SVRE and CPNG each saw 2-3 insiders acquiring shares.
Yesterday's session saw sharp declines in BC8.DE, ZHAOF, and SMGKF, dropping 18.2%, 17.5%, and 14.8% respectively. Today, 198 companies report earnings, with TCPI.JK and VAPORES.SN showing accumulation patterns while TLKM.JK and MIKA.JK exhibit distribution signals ahead of their reports. No companies are scheduled to report tomorrow.