The Edge
Know What They Know
🐷 PIG ROAST
💬 Word on the Street
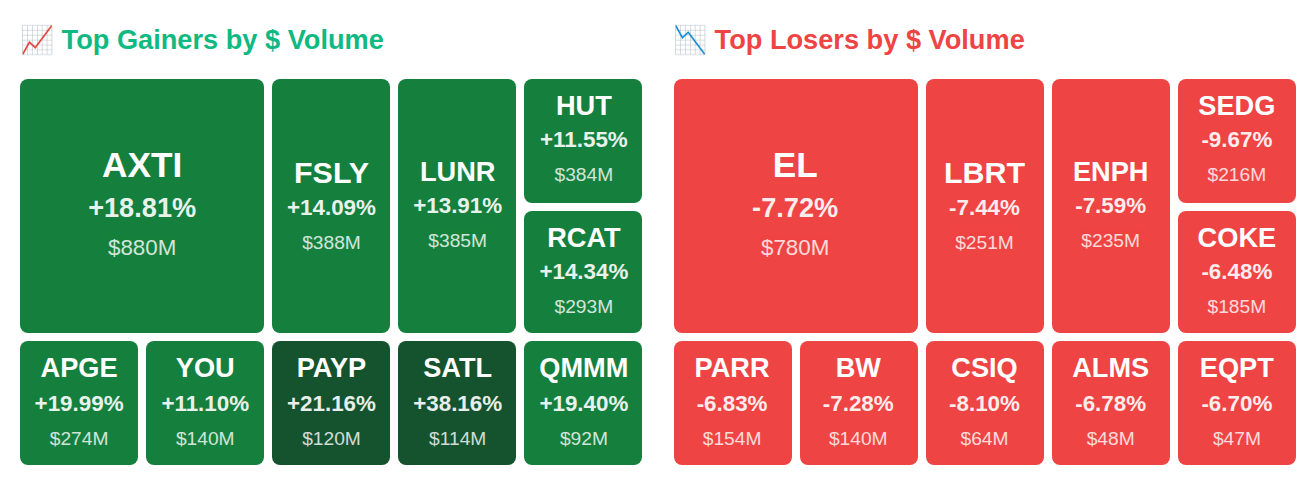
While Rep. David Taylor quietly added Parker-Hannifin Corporation (PH) to his portfolio and insiders at Wheeler Real Estate Investment Trust (WHLR) unloaded $31.54 billion in stock, the real fireworks happened after the bell—where a trio of beaten-down names staged double-digit rips that have nothing to do with fundamentals and everything to do with momentum-chasing algos feasting on scraps. The VIX cooled 1.5% to 26.8 as smart money logged $4.78 trillion in net inflows, but the action in optics darlings and semiconductor comebacks tells a wilder story than the aggregate flows suggest. Here's what smart money is doing today.
📚 Jargon Buster
Deflation
Prices actually falling. Sounds great until companies stop making money and fire everyone.
Equity market fear remains elevated with the VIX at 26.78, though it declined 1.5% over the past week from even higher levels, indicating that investors continue to price in significant uncertainty for stocks. In contrast, bond market volatility as measured by the MOVE index sits at just 13.32 after falling 7.7% week-over-week, suggesting Treasury traders see relatively calm conditions ahead for fixed income. This divergence between elevated equity volatility and subdued bond volatility reflects a market where stock investors remain on edge while bond markets have stabilized considerably.

|| Market Sutra ||
"Rotation is the market's way of breathing."
— 2021 saw money flow from tech into cyclicals as yields shifted
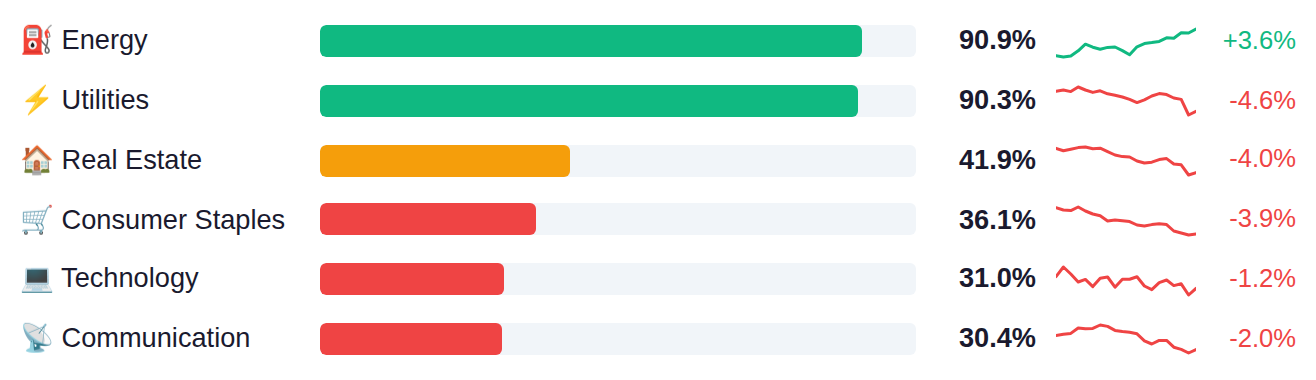
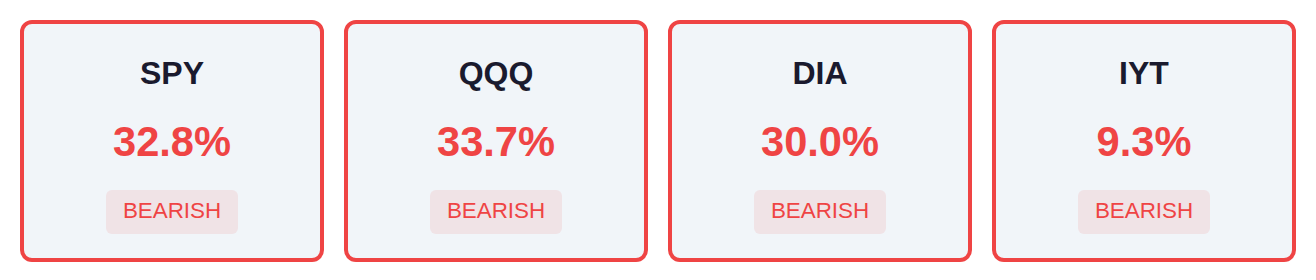
Market breadth remains narrow with only one-third of stocks in the S&P 500 and Nasdaq 100 trading above their moving averages, while defensive sectors show unusual strength with Energy and Utilities leading at over 90% breadth. The significant underperformance in traditionally growth-oriented areas like Semiconductors at 21% and weakness in Transports at just 9% breadth contrasts sharply with the defensive sector leadership, suggesting investors are rotating toward more stable cash-flowing businesses. This divergence between defensive sector strength and weakness in cyclical growth areas indicates a risk-off positioning despite headline index levels.
As of March 18, Fed net liquidity stands at $6.66 trillion, up $9.6 billion week-over-week, indicating a modest expansion in system liquidity that historically correlates with supportive conditions for risk assets. The next H.4.1 release drops Thursday, March 26, which will show whether this liquidity injection continues or reverses.
Yesterday's Chicago Fed National Activity Index dropped to -0.11, missing estimates of 0.27 by 38 basis points and reversing from February's 0.2 reading, while the Atlanta Fed's GDPNow model cut its Q1 GDP forecast from 2.3% to 2.0%, marking a downward revision that suggests economic momentum is slowing more than consensus anticipated. Today's flash PMI data takes center stage, with services expected to decline to 50.4 from 51.7 and manufacturing forecast at 50.2 versus 51.6 prior, putting both indexes dangerously close to the 50 threshold that separates expansion from contraction—a level that would mark the weakest manufacturing reading since October 2023 if realized. Tomorrow's import price data (estimated up 0.5% versus 0.2% prior) will test whether inflationary pressures are re-accelerating through the supply chain, while oil inventory figures continue to signal demand trends after last week's surprise 6.2 million barrel crude build that rattled energy markets.
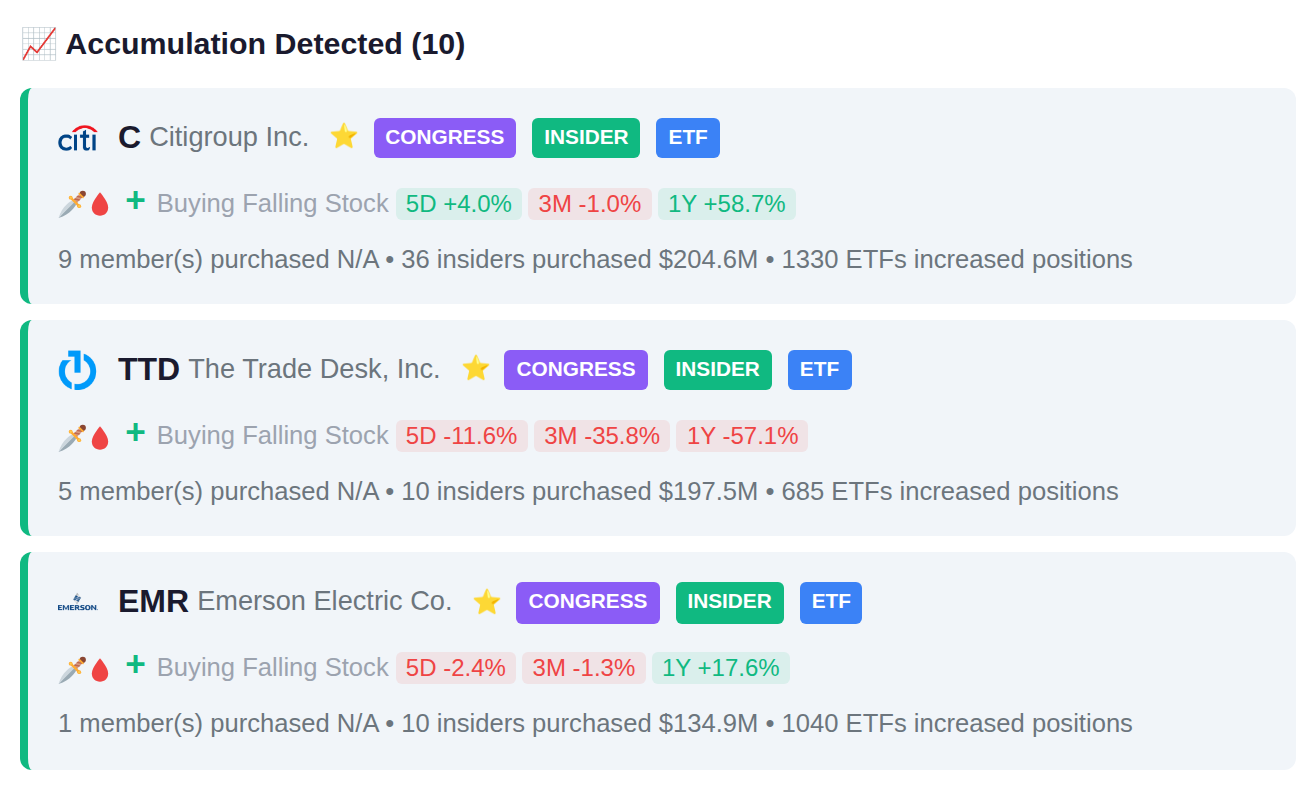
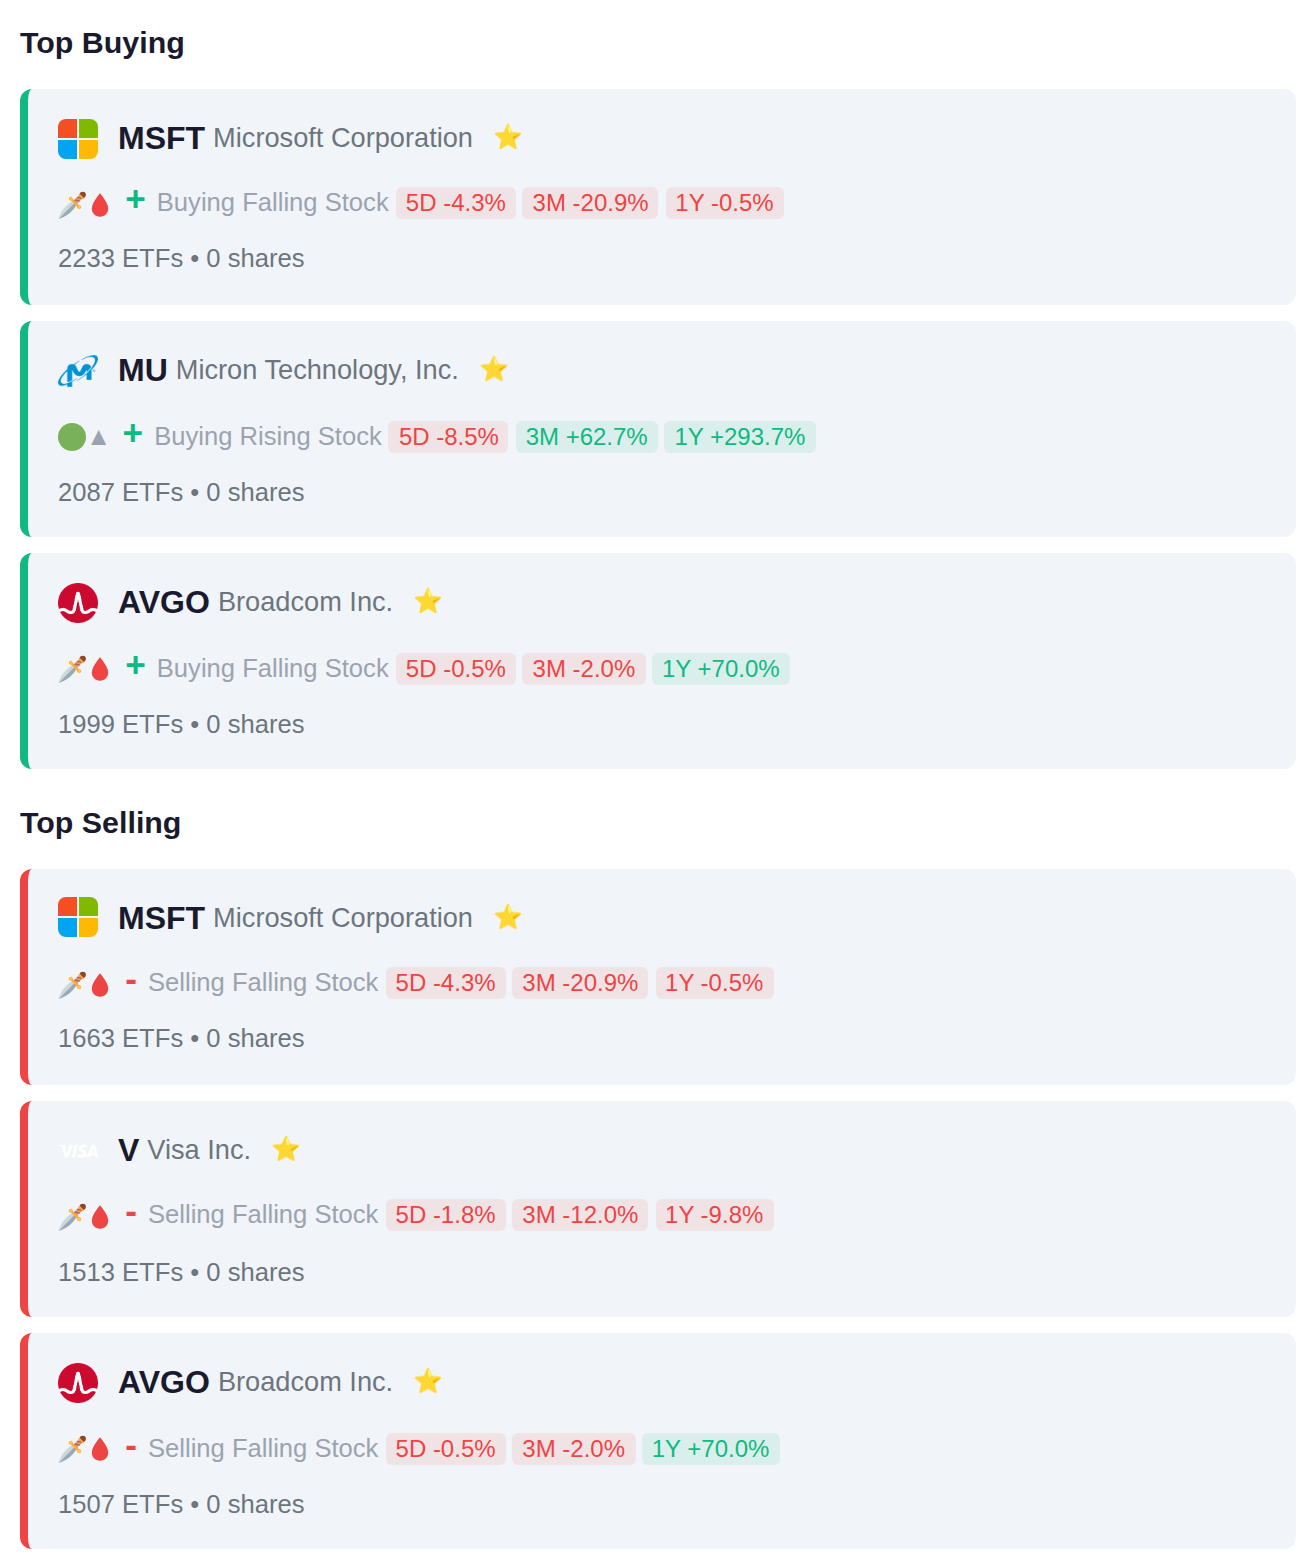
Large institutional money shows mixed positioning in mega-cap technology, with 2,233 ETFs adding Microsoft exposure while 1,663 simultaneously reduced it, and similar split flows in Broadcom (1,999 adding vs 1,507 removing). The data reveals balanced institutional sentiment across software, payments, and semiconductor names, suggesting sector rotation within technology rather than broad directional conviction.
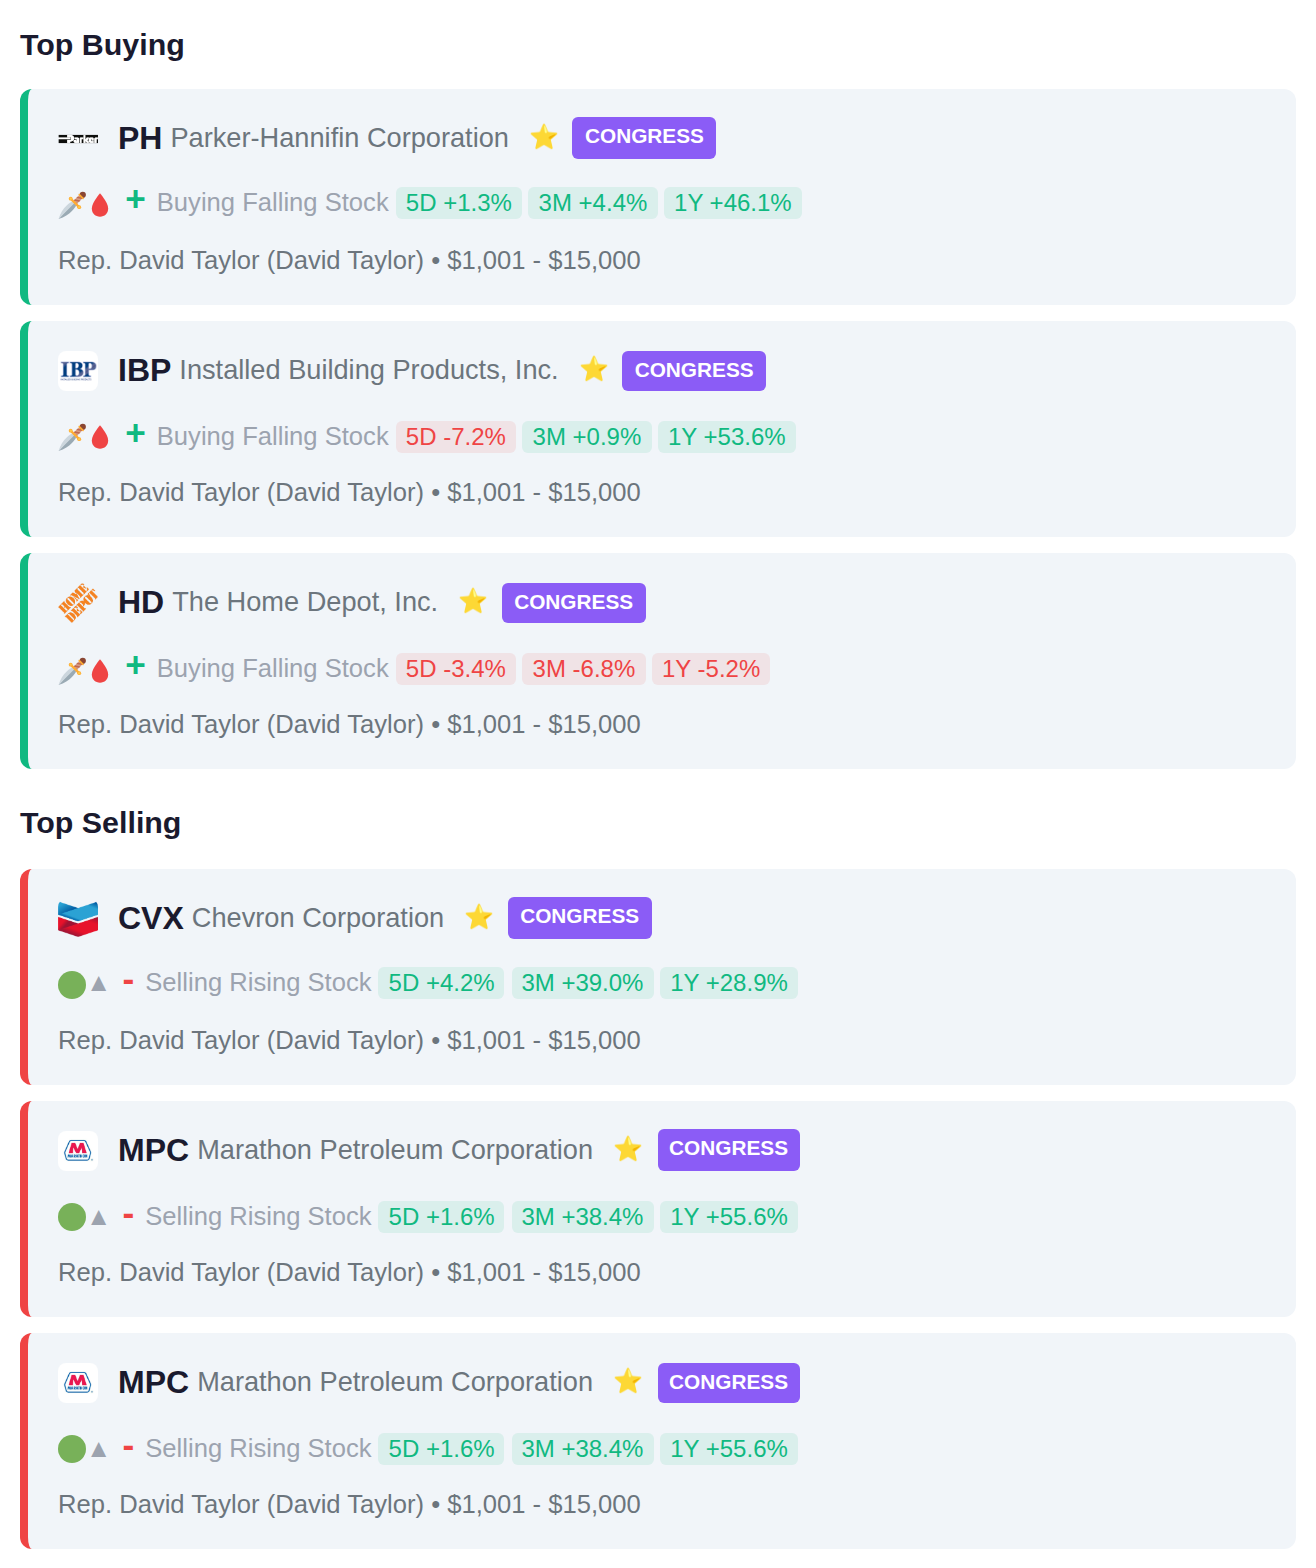
Rep. David Taylor recently purchased shares of Parker-Hannifin (PH), Installed Building Products (IBP), and Home Depot (HD), while selling positions in Chevron (CVX) and Marathon Petroleum (MPC). The Representative's transactions indicate a rotation out of energy sector holdings into industrial and home improvement retail stocks.
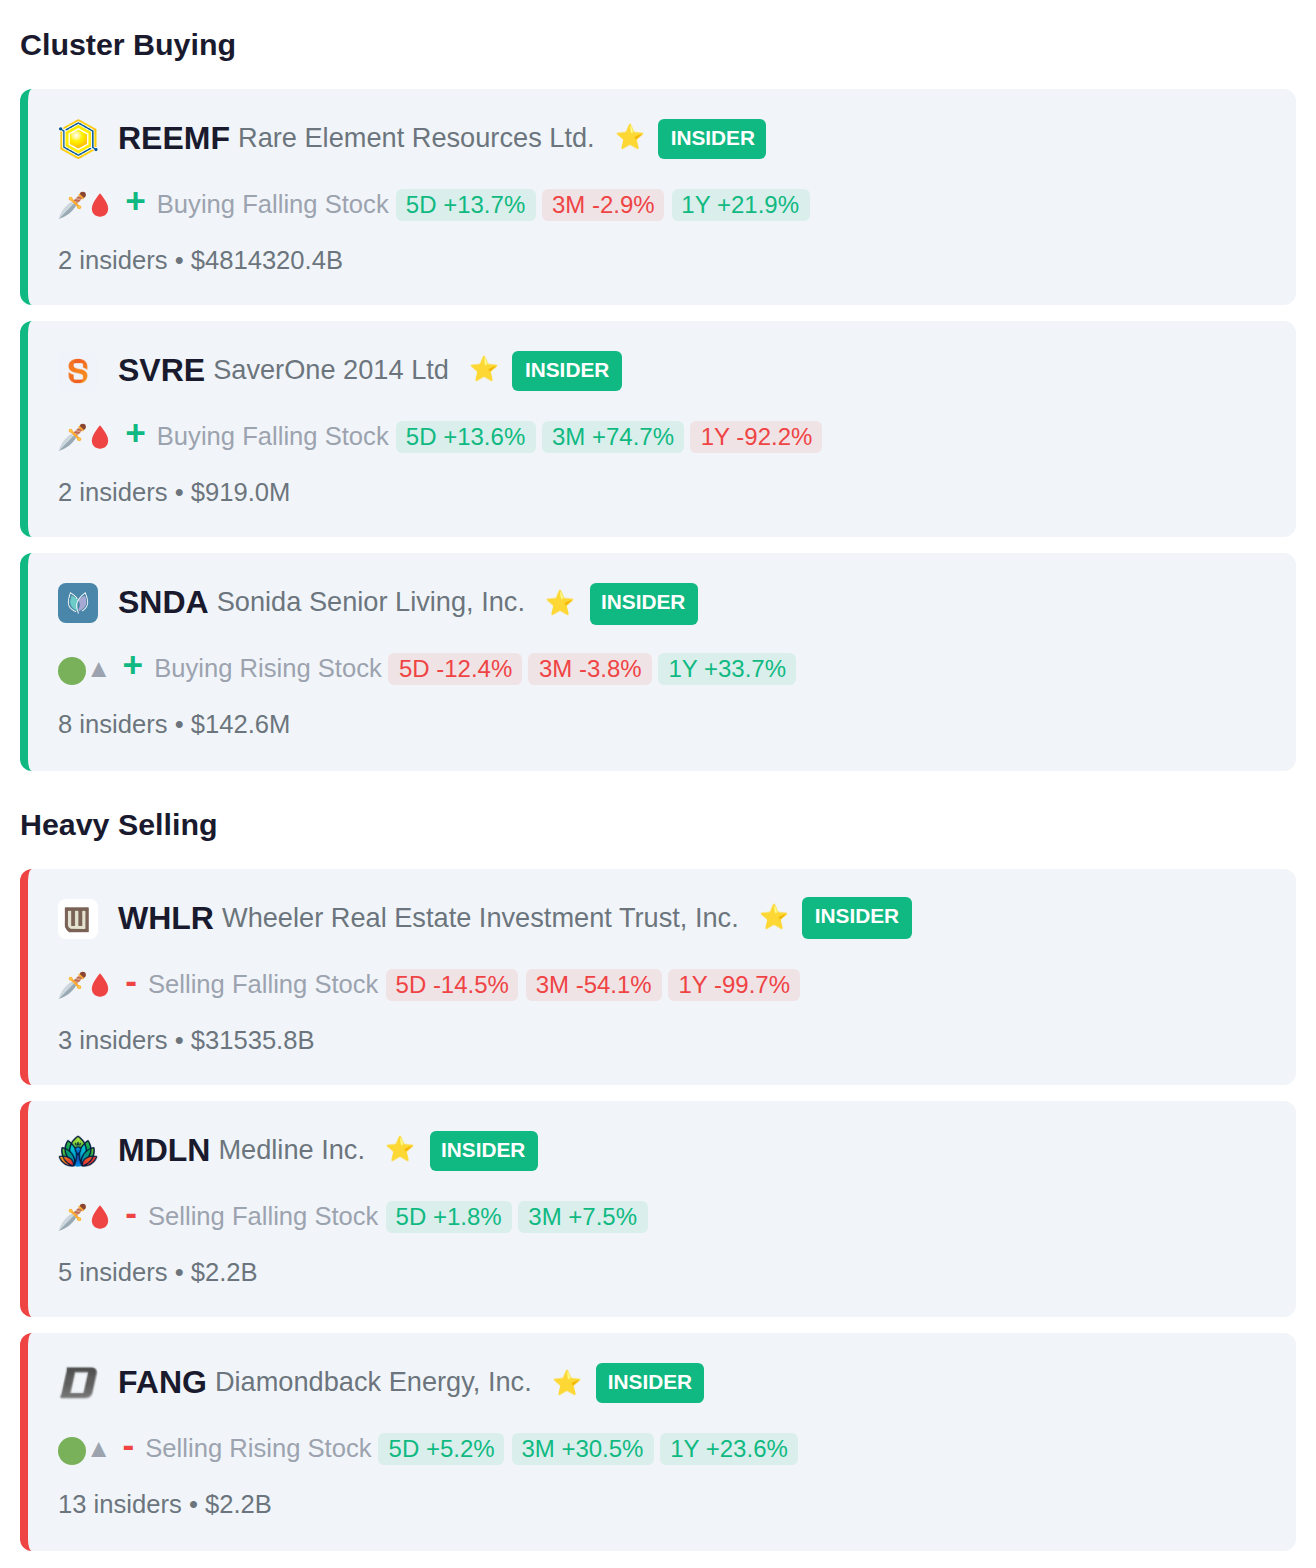
Recent insider activity shows notable cluster patterns with 8 insiders acquiring positions in SNDA, while FANG saw 13 insiders reducing their stakes for $2.2B in aggregate proceeds. On the distribution side, WHLR recorded $31.5B in insider sales across 3 executives, and MDLN had 5 insiders sell positions totaling $2.2B.
218 stocks report earnings today, with accumulation signals appearing in INPP.JK and VAPORES.SN ahead of their releases, indicating recent institutional buying activity. Distribution patterns have emerged in TLKM.JK and MTEL.JK, where smart money has reduced positions going into today's earnings reports.