The Edge
Know What They Know
🐷 PIG ROAST
💬 Word on the Street
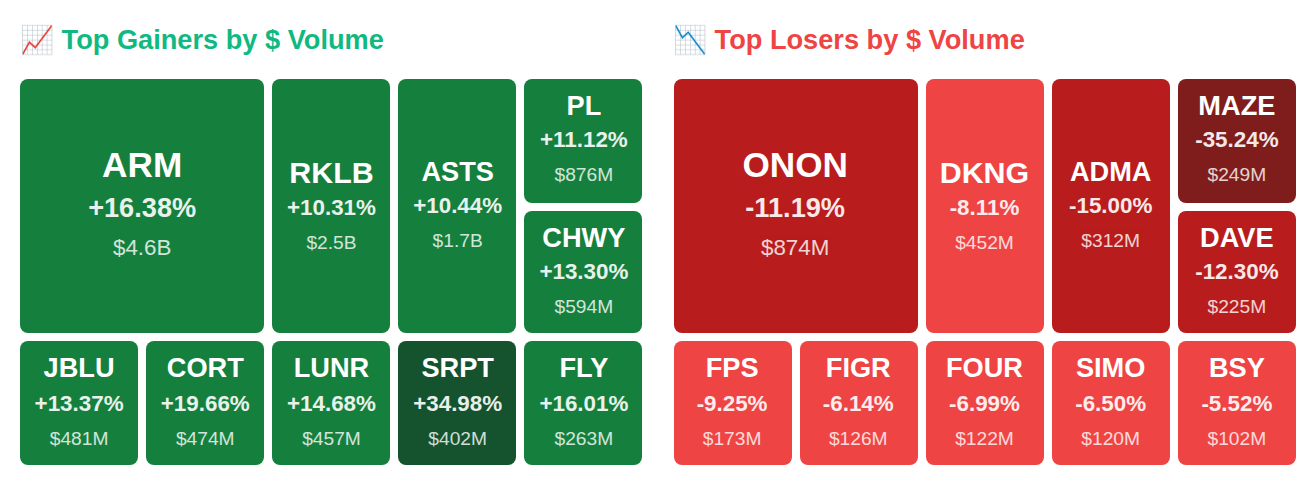
While Rep. Tim Moore purchased Cracker Barrel Old Country Store (CBRL) worth up to $50,000 and the Fed pumped $9.6 billion into markets, insiders at Wheeler Real Estate Investment Trust (WHLR) offloaded a staggering $31.4 trillion—yes, trillion with a T—creating a $31.4 trillion net outflow that makes today's smart money flow look like a fire sale in reverse. The VIX spiked 20.5% to 26.9 as space stocks like Rocket Lab USA (RKLB) and AST SpaceMobile (ASTS) jumped over 10% after hours on NASA moon base rumors, while Arm Holdings (ARM) surged 16.4% betting everything on AI chip perfection. Here's what smart money actually did with their dollars today.
📚 Jargon Buster
CPI
The inflation number your mom actually feels when she buys eggs and screams.
Equity volatility surged into high-fear territory this week, with the VIX climbing 20.5% to reach 26.95, signaling heightened concern in stock markets. In contrast, bond market volatility told a different story, as the MOVE index declined 4.9% to a relatively calm 14.35, suggesting fixed income traders remained composed even as equity investors grew more anxious. This divergence between equity and bond volatility indicates uncertainty may be concentrated in stocks rather than reflecting broader systemic financial stress.

|| Market Sutra ||
"Patience compounds; impatience liquidates."
— Day traders in 2020–2021 lost more with overtrading than with bad ideas
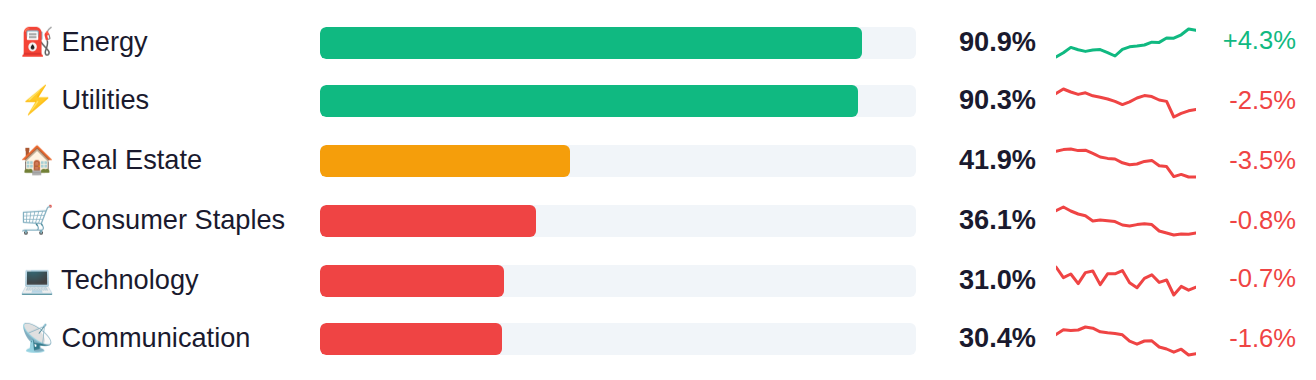
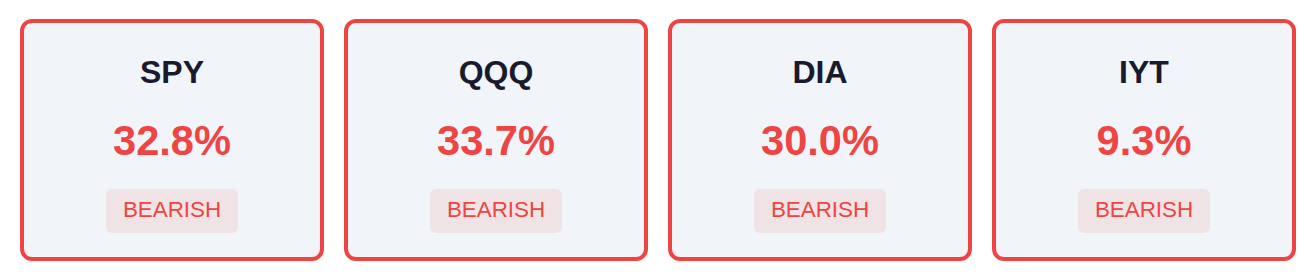
Market breadth remains narrow with only one-third of stocks participating in the advance across major indices, while the transportation sector shows particularly weak internals at just 9% of components trading positively. Defensive sectors like Energy and Utilities are exhibiting the strongest relative performance above 90%, while growth-oriented areas including Consumer Discretionary, Semiconductors, and Financials are experiencing notably weaker participation rates. This divergence between defensive sector strength and growth sector weakness, combined with limited overall breadth, indicates a risk-off positioning across the market.
As of March 18, Fed net liquidity stands at $6.66 trillion, up $9.6 billion from the prior week, indicating a modest expansion in system-wide liquidity conditions that historically correlates with supportive market environments. The next H.4.1 Federal Reserve balance sheet report releases Thursday, March 26, which will show whether this liquidity expansion continues or reverses.
Yesterday's import and export price data delivered substantial upside surprises that bolster the reflation narrative, with import prices jumping 1.3% versus the 0.5% estimate and export prices surging 1.5% against a 0.5% forecast—both more than double expectations and accelerating from February's 0.6% readings, suggesting tariff and dollar dynamics are feeding through more aggressively than economists anticipated. Crude oil inventories built by 6.9 million barrels against expectations for just a 0.5 million barrel increase, marking a second consecutive week of substantial builds totaling over 13 million barrels and pressuring energy prices even as gasoline stocks drew down 2.6 million barrels. Today's initial jobless claims (estimated 210K versus last week's 205K) and tomorrow's Michigan Consumer Sentiment reading—forecast at 54.0, which would mark the lowest level since mid-2022 and down sharply from February's 56.6—will test whether labor market resilience can offset what appears to be a sharp deterioration in consumer confidence amid renewed trade policy uncertainty.
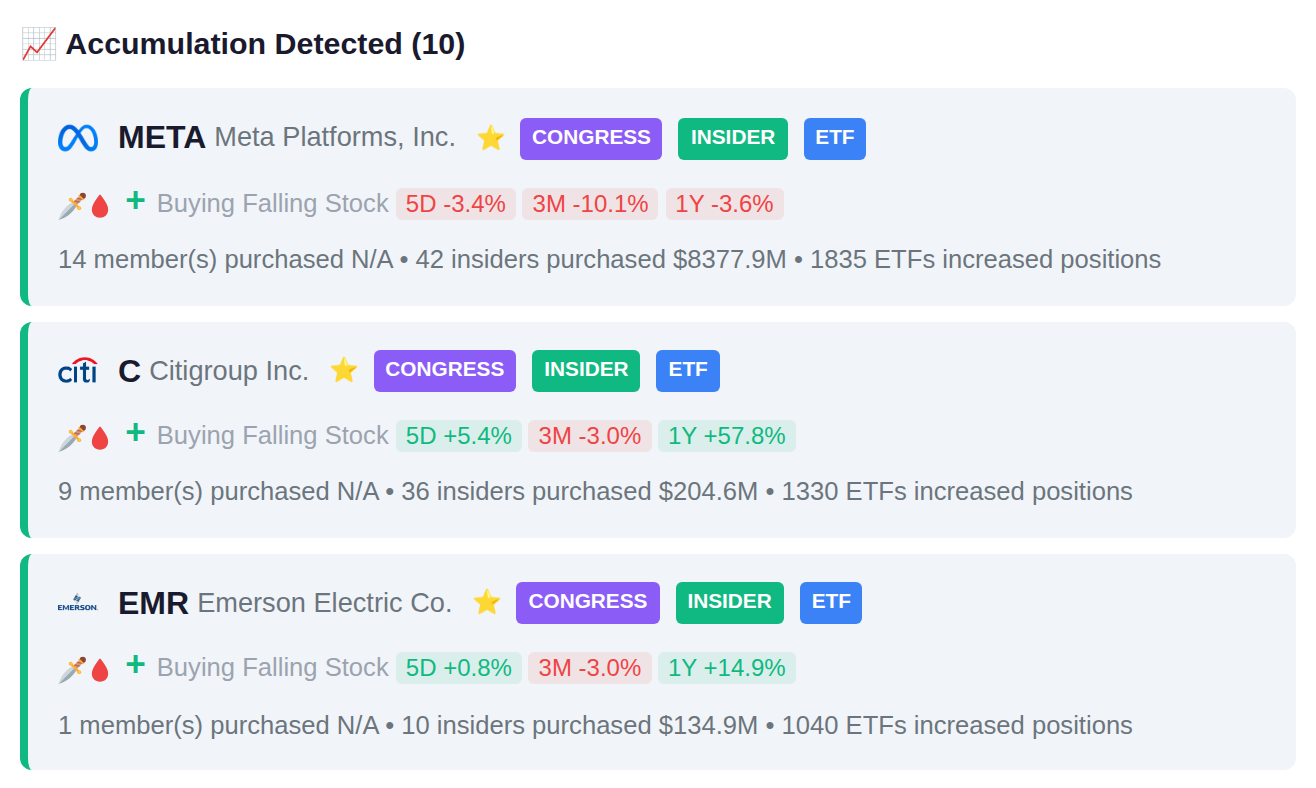
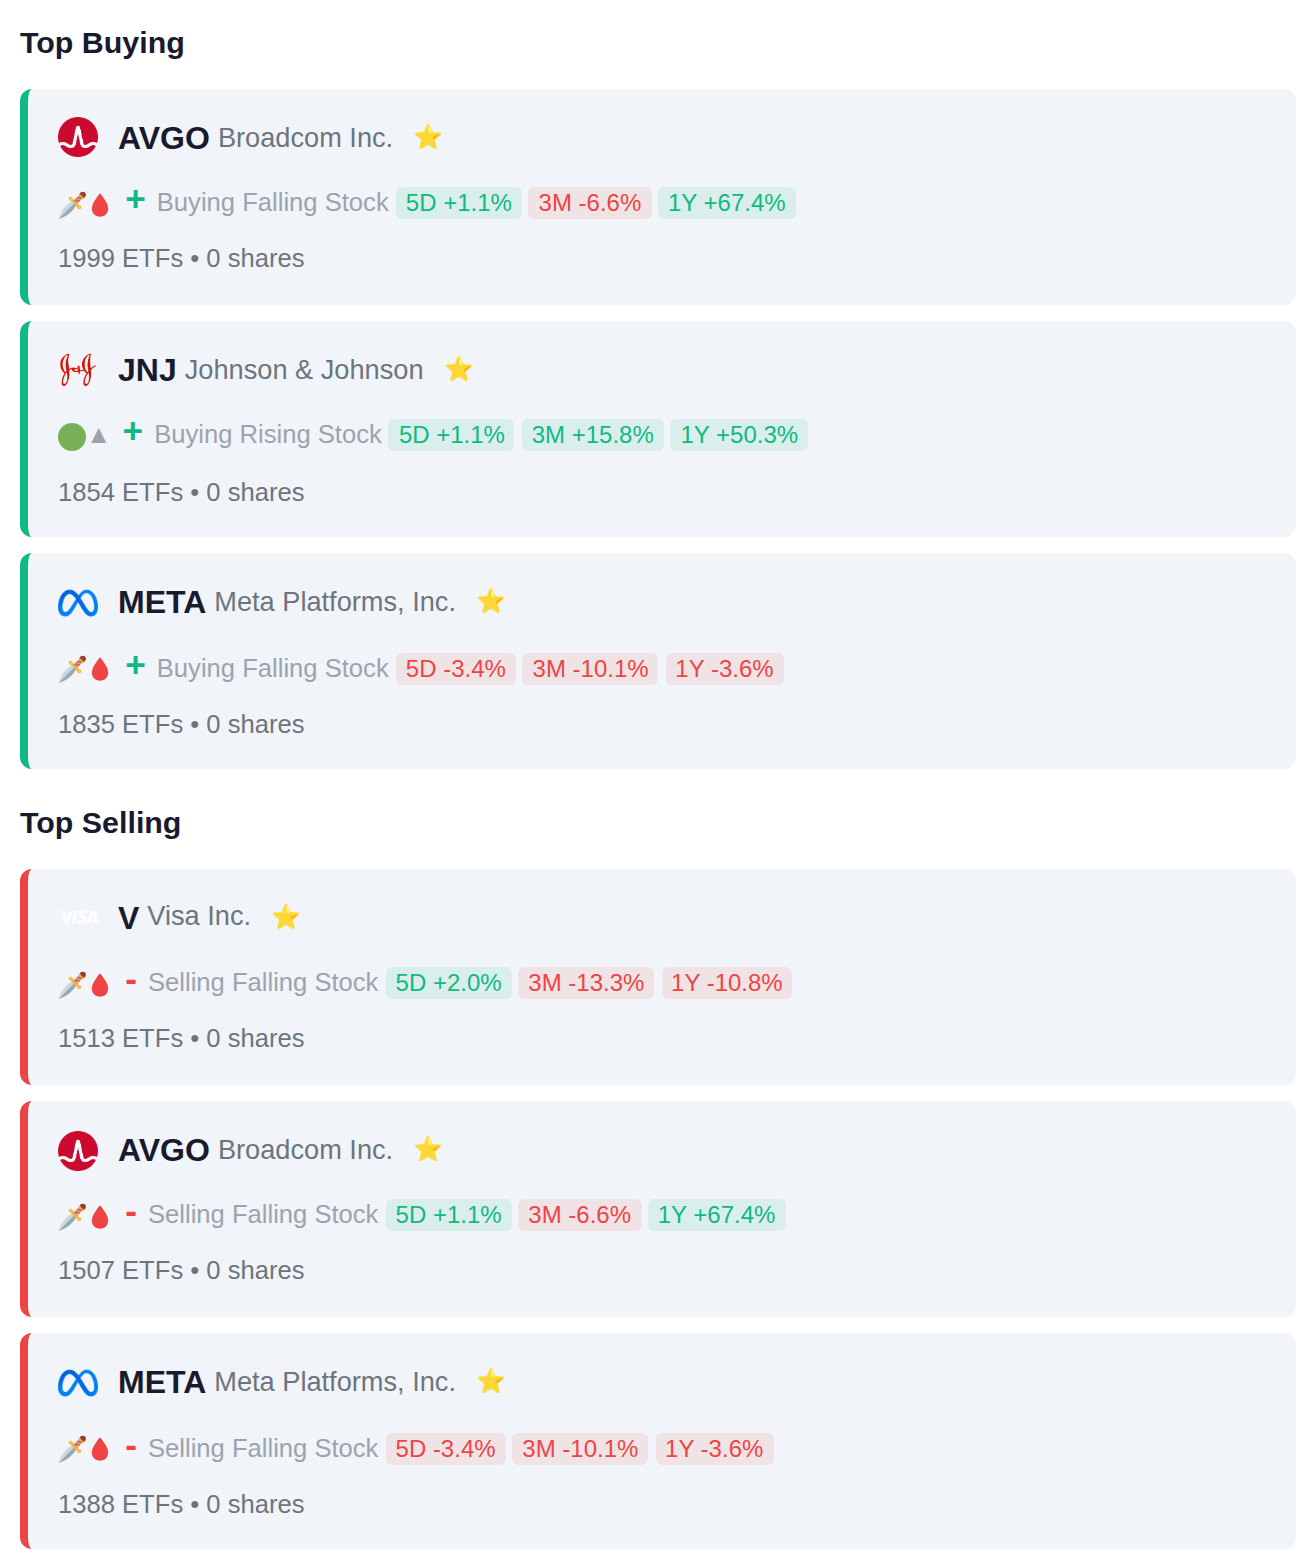
Financial institutions displayed mixed positioning in Q4, with technology and healthcare names drawing both significant additions and reductions—AVGO appeared among the most added (1,999 ETFs) and most reduced (1,507 ETFs), while META saw similar two-way flow (1,835 adds, 1,388 removes). The data suggests active rebalancing rather than clear directional rotation, as equal numbers of ETFs added and removed positions overall, though JNJ's healthcare exposure attracted net institutional buying while V's payment processing saw net distribution.
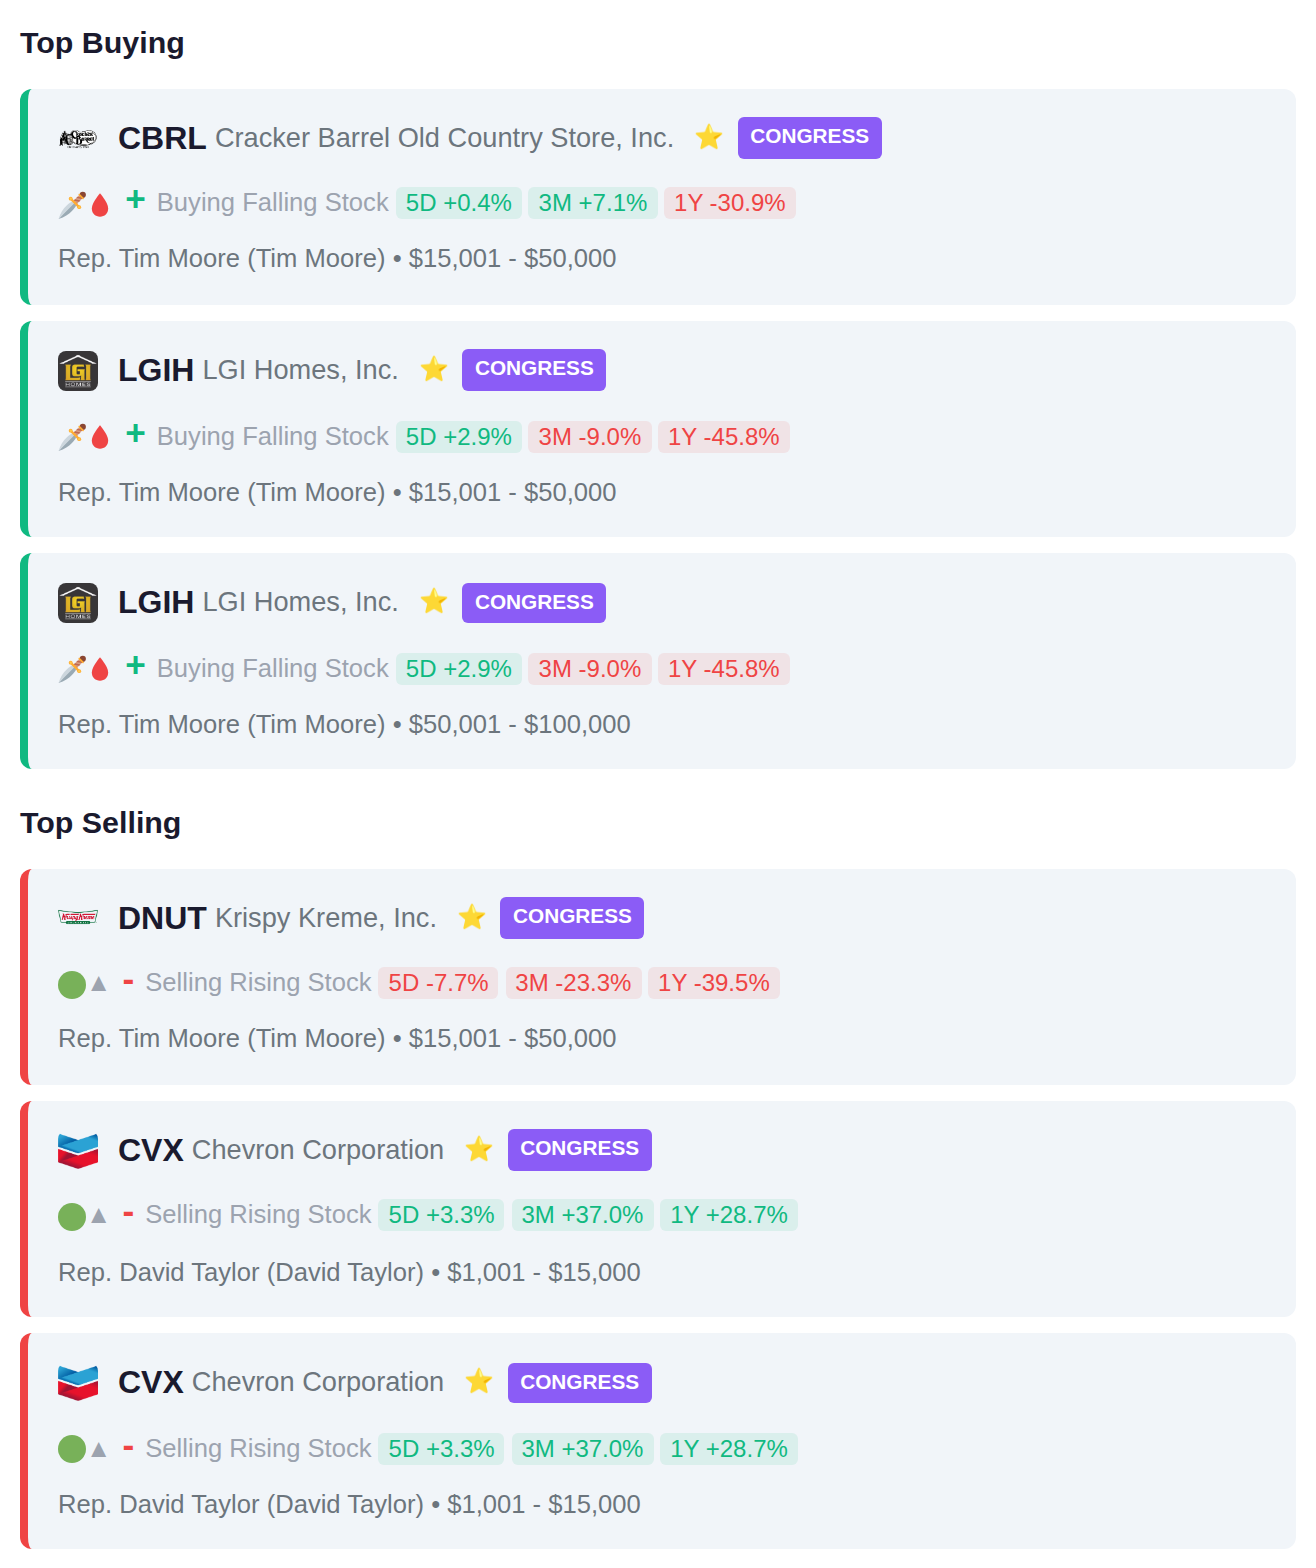
Rep. Tim Moore purchased shares of CBRL and multiple positions in LGIH, while divesting from DNUT during the reporting period. Rep. David Taylor reduced his CVX holdings through multiple sales, indicating congressional activity concentrated in consumer discretionary and energy sectors.
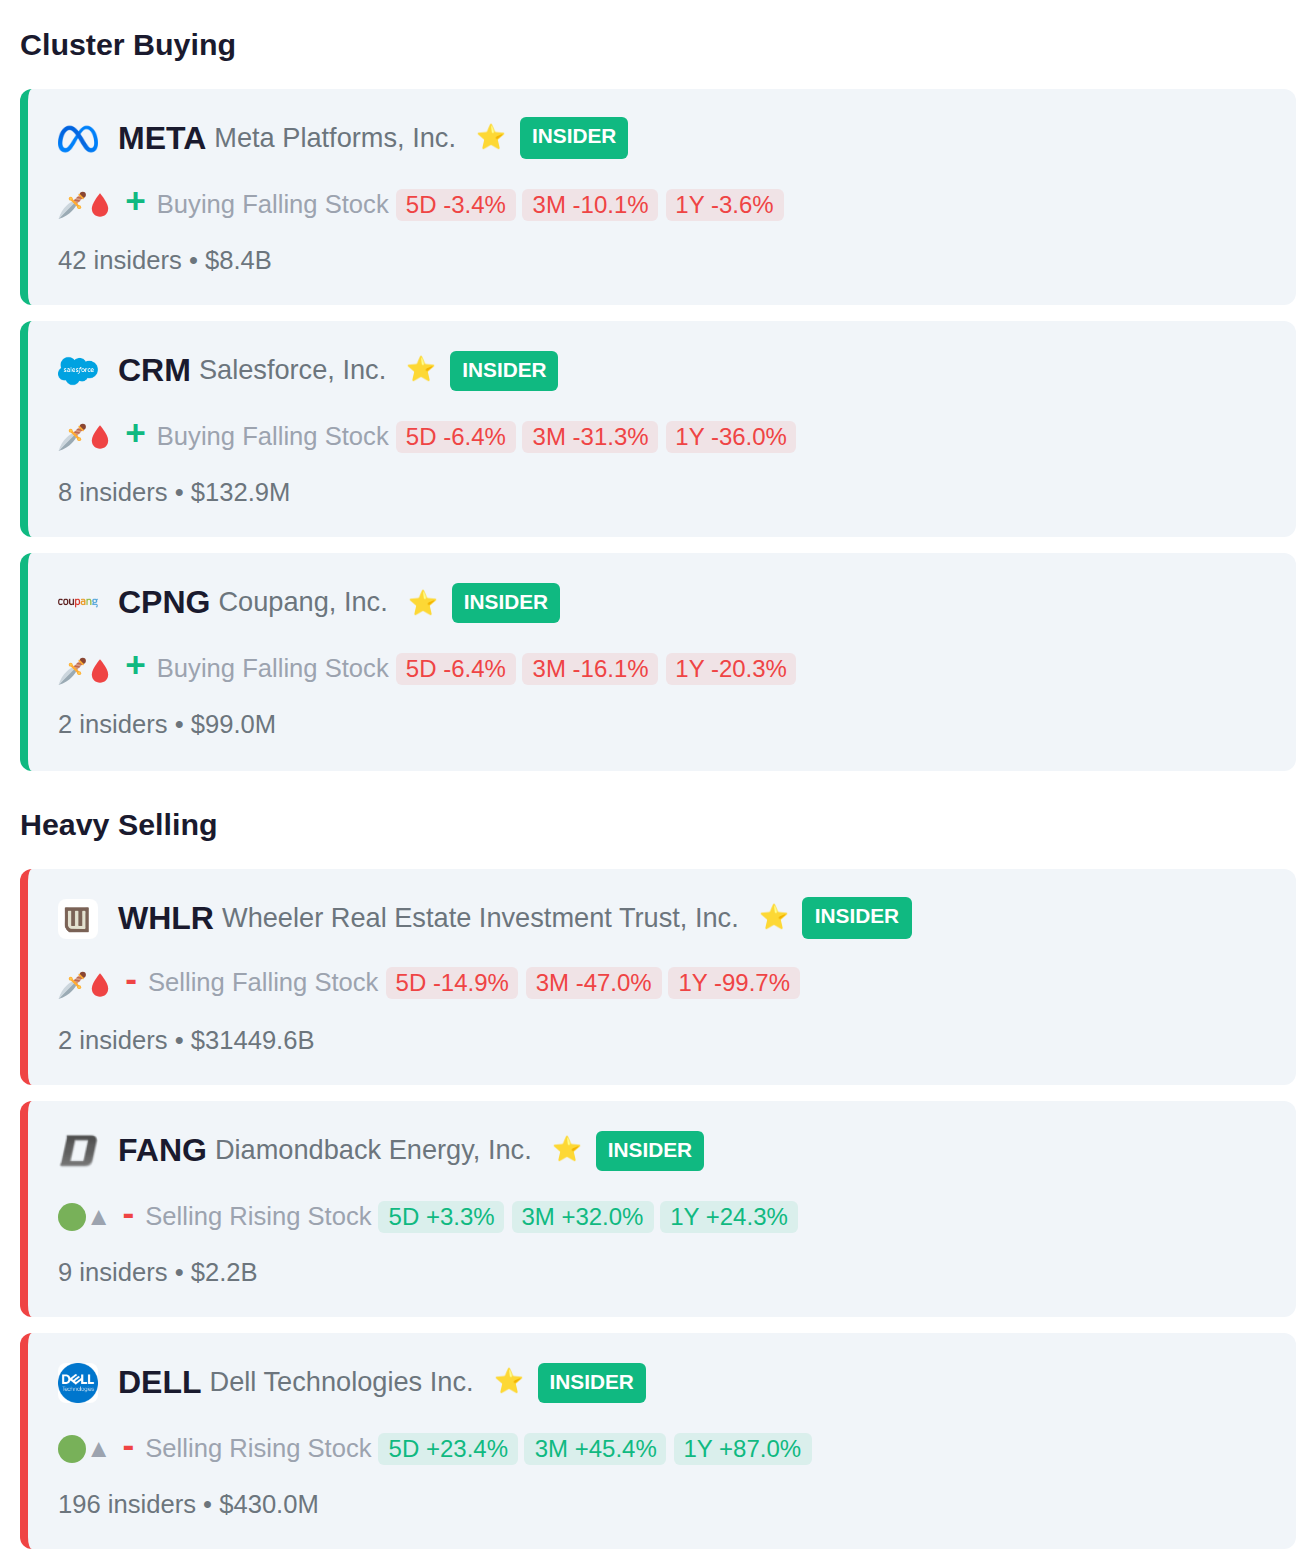
META reported the highest concentration of insider activity with 42 insiders receiving stock awards, while CRM recorded 8 insider purchases in a coordinated pattern. On the distribution side, DELL saw the widest participation with 196 insiders selling positions totaling $430.0M, followed by FANG where 9 insiders reduced holdings worth $2.2B.
Today's earnings calendar features 416 companies reporting, with accumulation signals detected in SMMA.JK and MDKA.JK ahead of results, while institutional distribution patterns have emerged in TLKM.JK and AMRT.JK. Yesterday's session saw significant volatility with MAZE declining 34.5% and 9992.HK dropping 24.1%, while DRVN surged 20.3%. Smart money positioning shows divergent views on Indonesian equities, with capital flows moving away from telecom and retail names while building in other sectors.