The Edge
Know What They Know
🐷 PIG ROAST
💬 Word on the Street
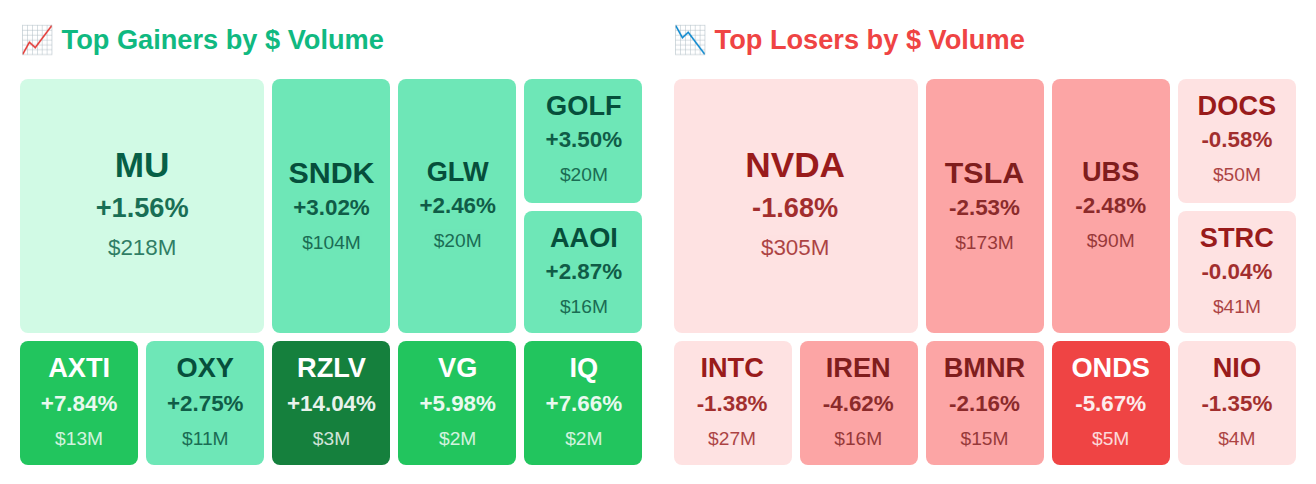
While Rep. Tim Moore (R-NC) quietly scooped up Cracker Barrel Old Country Store (CBRL) shares worth $15,001 to $50,000, smart money dumped a staggering $31.4 trillion—yes, trillion—with Wheeler Real Estate Investment Trust (WHLR) insiders alone unloading $31.4 trillion as fear spiked the VIX 14.1% to 27.4. After hours brought the chaos: Argan (AGX) rocketed 37.9% to $566 on monster earnings, Unity Software (U) surged 13.5% to $19.45 on preliminary results despite being down 56% year-to-date, and fraud-plagued ADMA Biologics (ADMA) bounced 11.6% to $9.25 even as investigators circle. Here's what smart money is doing today.
📚 Jargon Buster
NFP
Non-Farm Payrolls. The first Friday monthly jobs number that makes traders crap their pants at 8:30 a.m. sharp.
Equity market volatility surged into high fear territory this week, with the VIX climbing 14.1% to 27.44, signaling heightened investor concern about stock price swings in the near term. In contrast, bond market volatility remains subdued, as the MOVE index rose 32.8% but sits at just 18.61, well below historical stress levels. This divergence suggests fear is concentrated in equities while fixed income markets are pricing in relatively stable interest rate expectations.

|| Market Sutra ||
"In markets, survival is alpha."
— Trend followers who survived the 1970s stagflation dominated the next decade
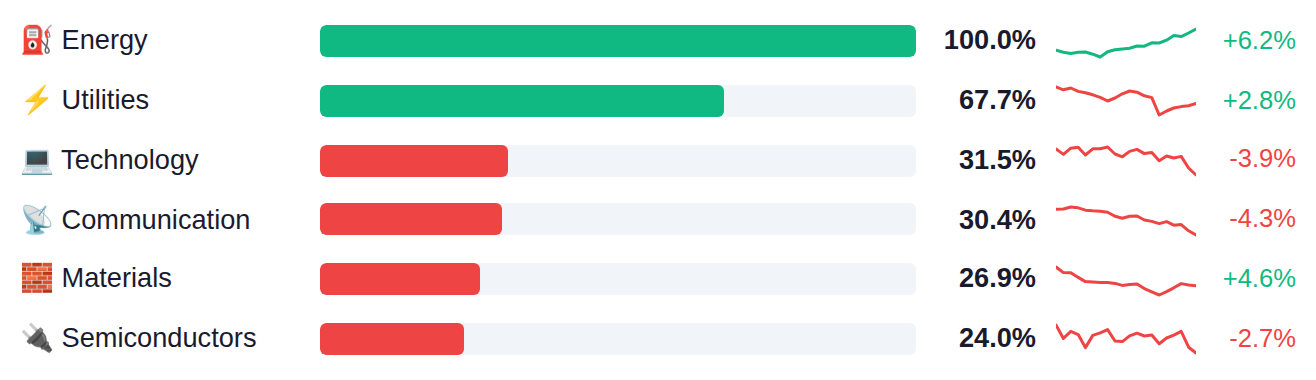
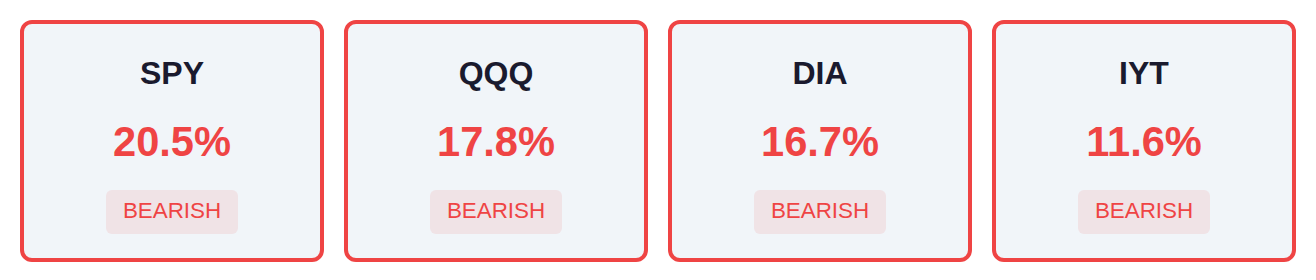
The current market regime shows defensive rotation with Energy and Utilities capturing the majority of institutional flows at 100% and 68% respectively, while cyclical sectors including Real Estate, Industrials, and Financials lag significantly below 10%. However, narrow market breadth across major indices tells a concerning story, with only 20% of SPY components participating in recent moves and even weaker breadth in QQQ and DIA at 18% and 17%. This combination of defensive sector leadership and weak underlying participation suggests institutions are concentrating capital in a limited number of names rather than broad-based risk-taking.
As of March 25, Fed net liquidity stood at $6.66 trillion, up $1.2 billion from the prior week, with the next H.4.1 release scheduled for Thursday, April 02. This modest weekly increase reflects relatively stable liquidity conditions, which historically correlate with sustained market support when liquidity expands and potential headwinds when it contracts.
Michigan Consumer Sentiment tumbled to 53.3, missing the 54.0 estimate and marking a sharp decline from February's 56.6, while the more concerning development was inflation expectations surging to 3.8% from 3.4%—a 40 basis point miss that reflects consumers' growing concern about price pressures despite the Fed's two-year tightening campaign. Meanwhile, CFTC positioning data showed speculative shorts on the S&P 500 decreased to -80.9K from -113.1K, indicating some bearish capitulation, while Nasdaq 100 net longs fell to 6.6K from 24.1K as traders reduced exposure to growth-heavy positions. With Fed Chair Powell speaking today alongside two other central bank officials and the critical CB Consumer Confidence data tomorrow (estimated at 88.0 versus 91.2 prior), markets will be parsing any reaction to Friday's sticky inflation expectations print and whether the Fed sees today's sentiment deterioration as warranting concern about the consumer spending outlook that has kept the economy resilient.
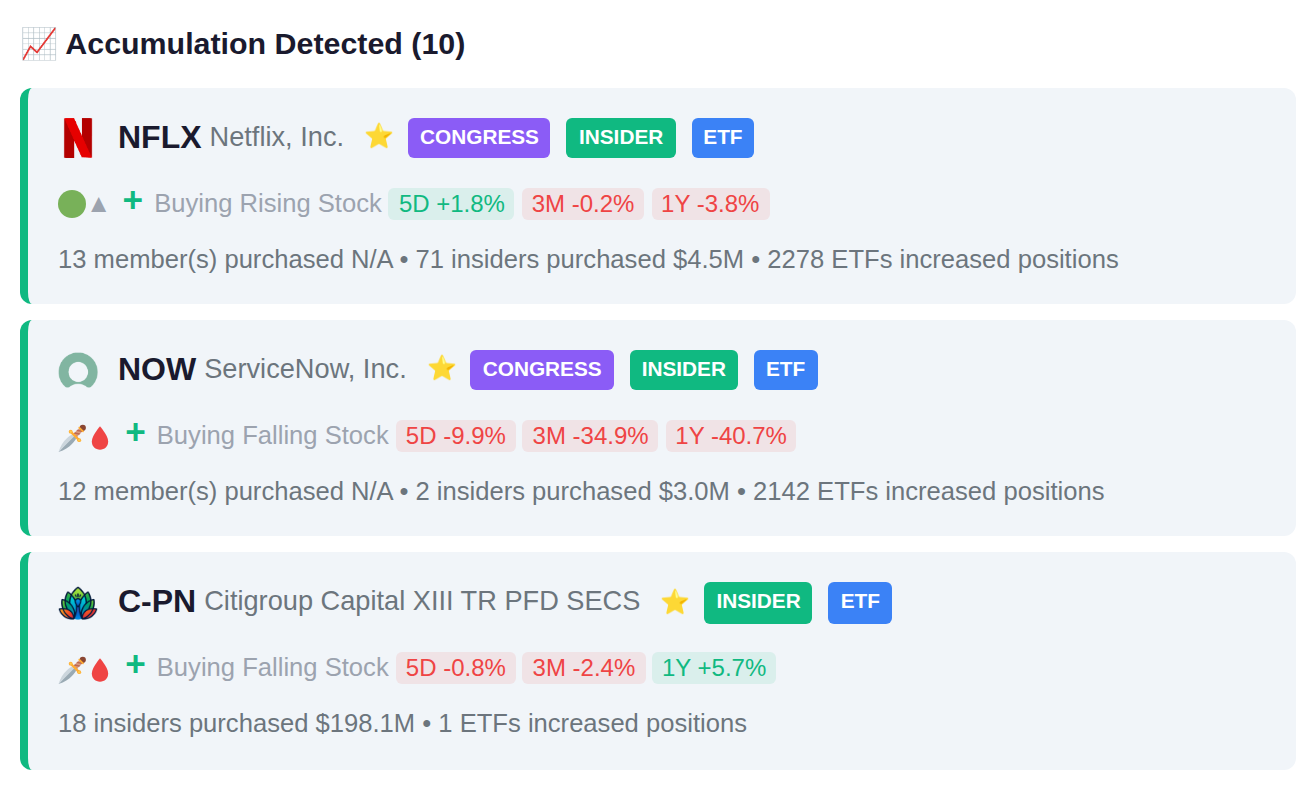
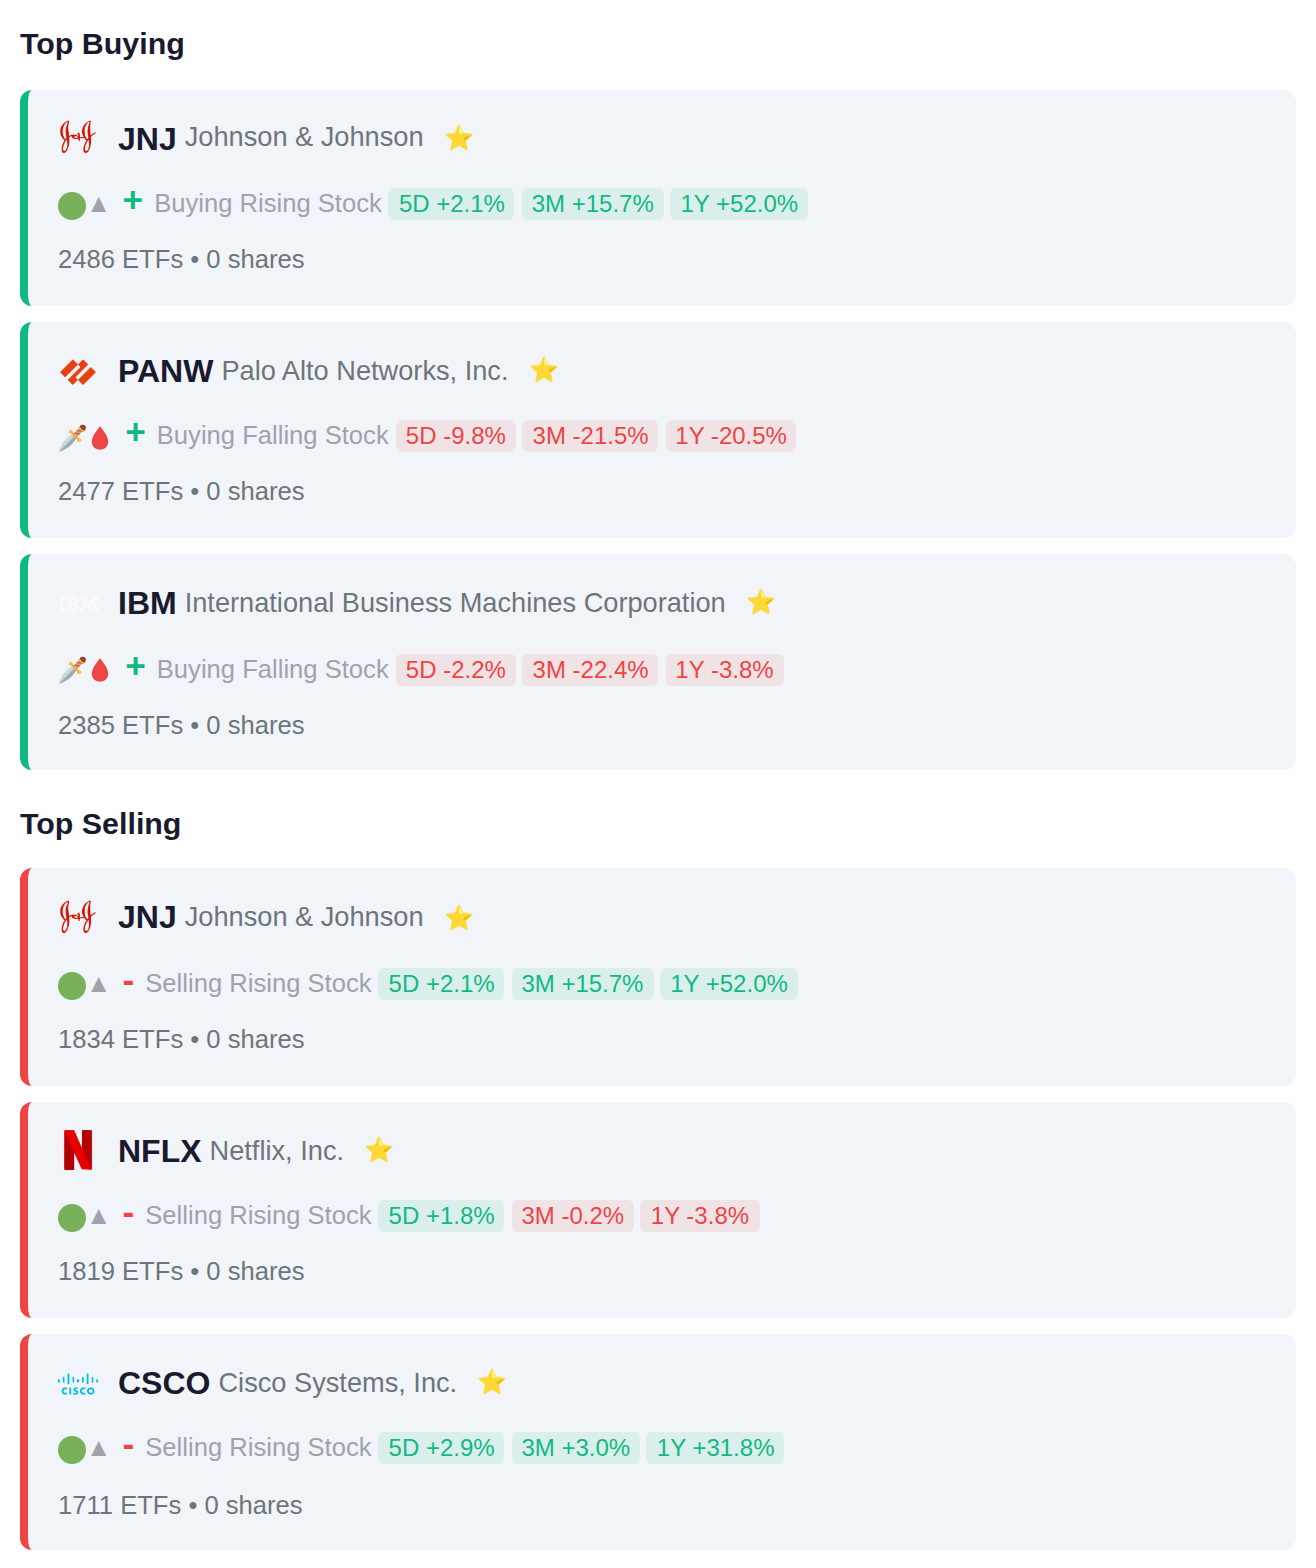
Institutional flow data shows balanced activity with 10 ETFs adding and 10 removing positions, though notable concentration appears in healthcare and technology names—JNJ led additions with 2,486 ETFs taking positions while simultaneously seeing 1,834 ETFs reduce exposure, suggesting potential rotation within the sector. Cybersecurity exposure increased via PANW additions (2,477 ETFs) while legacy tech names NFLX and CSCO saw meaningful position reductions (1,819 and 1,711 ETFs respectively), indicating a possible shift toward newer enterprise security plays from consumer streaming and established networking infrastructure.
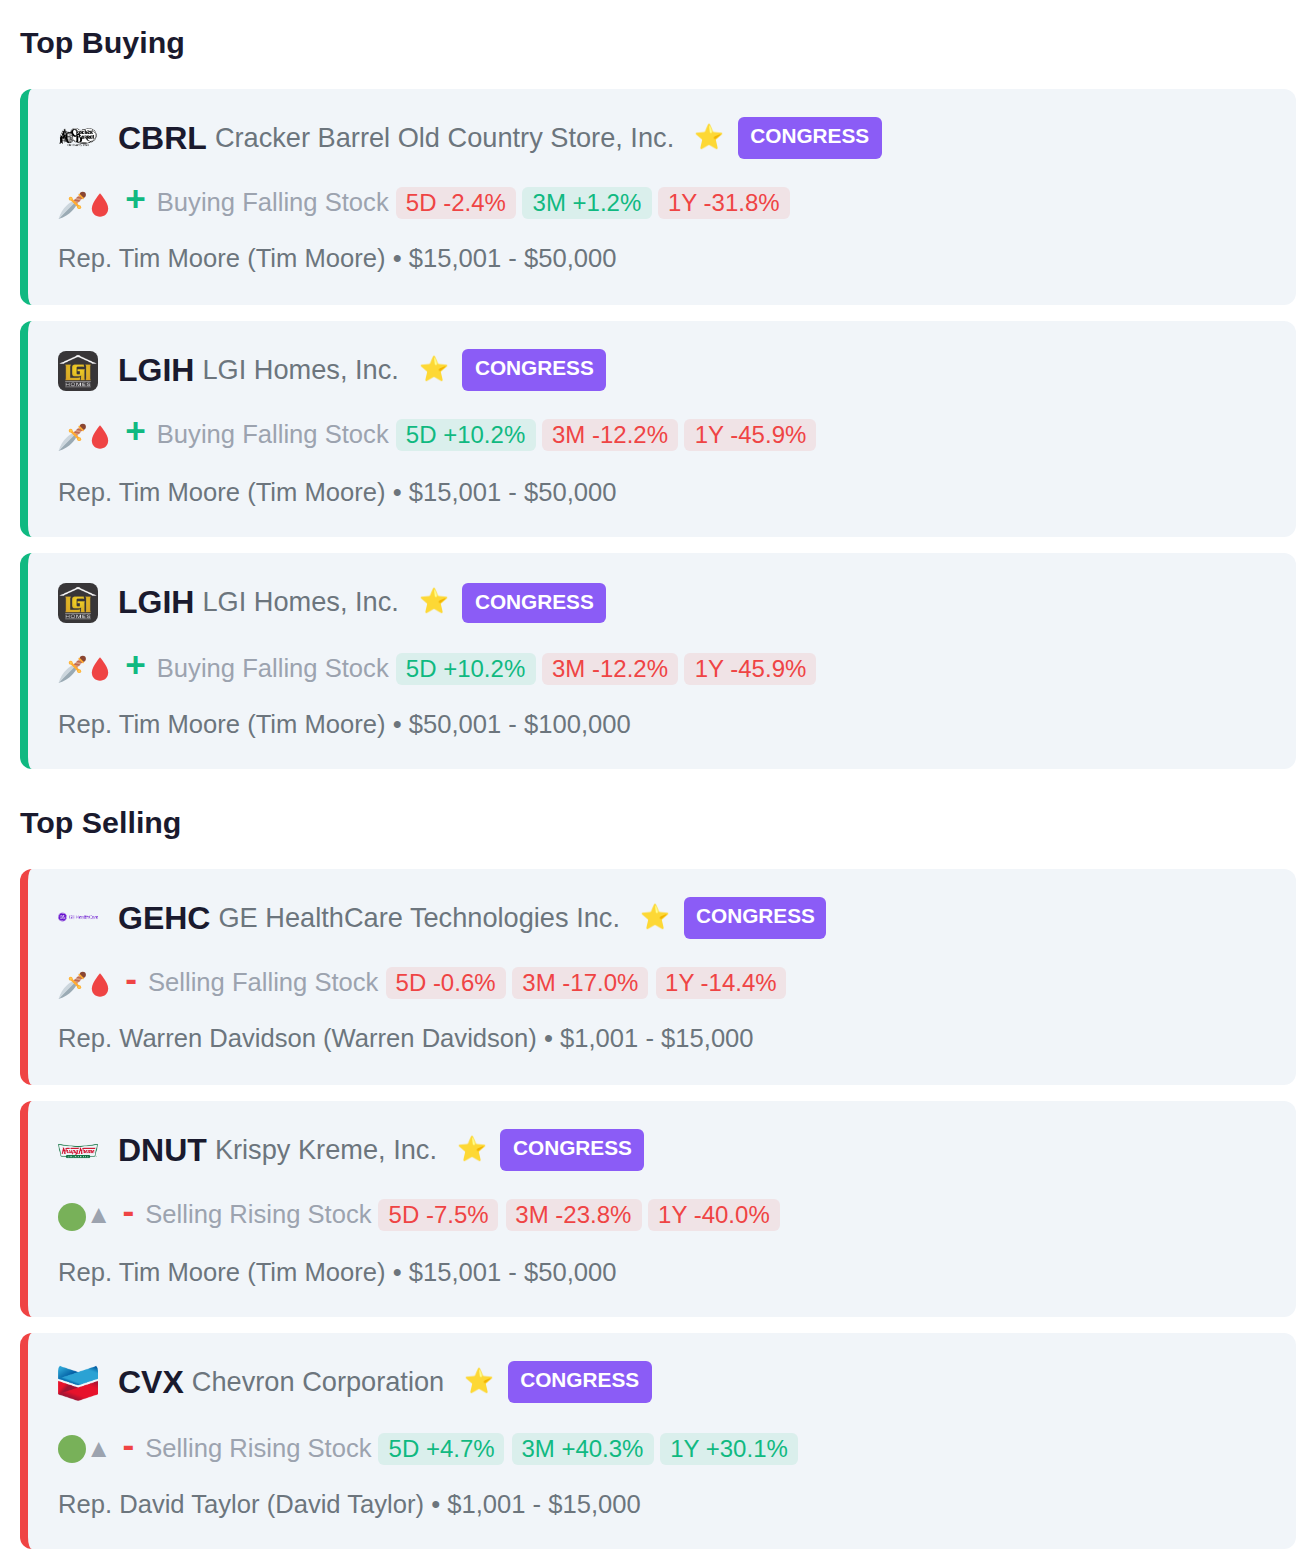
Rep. Tim Moore made multiple purchases in LGIH (two separate transactions) along with acquiring CBRL, while also selling DNUT. Rep. Warren Davidson sold GEHC and Rep. David Taylor sold CVX, showing mixed activity with Moore being the most active trader this period with concentrated buying in homebuilder LGIH.
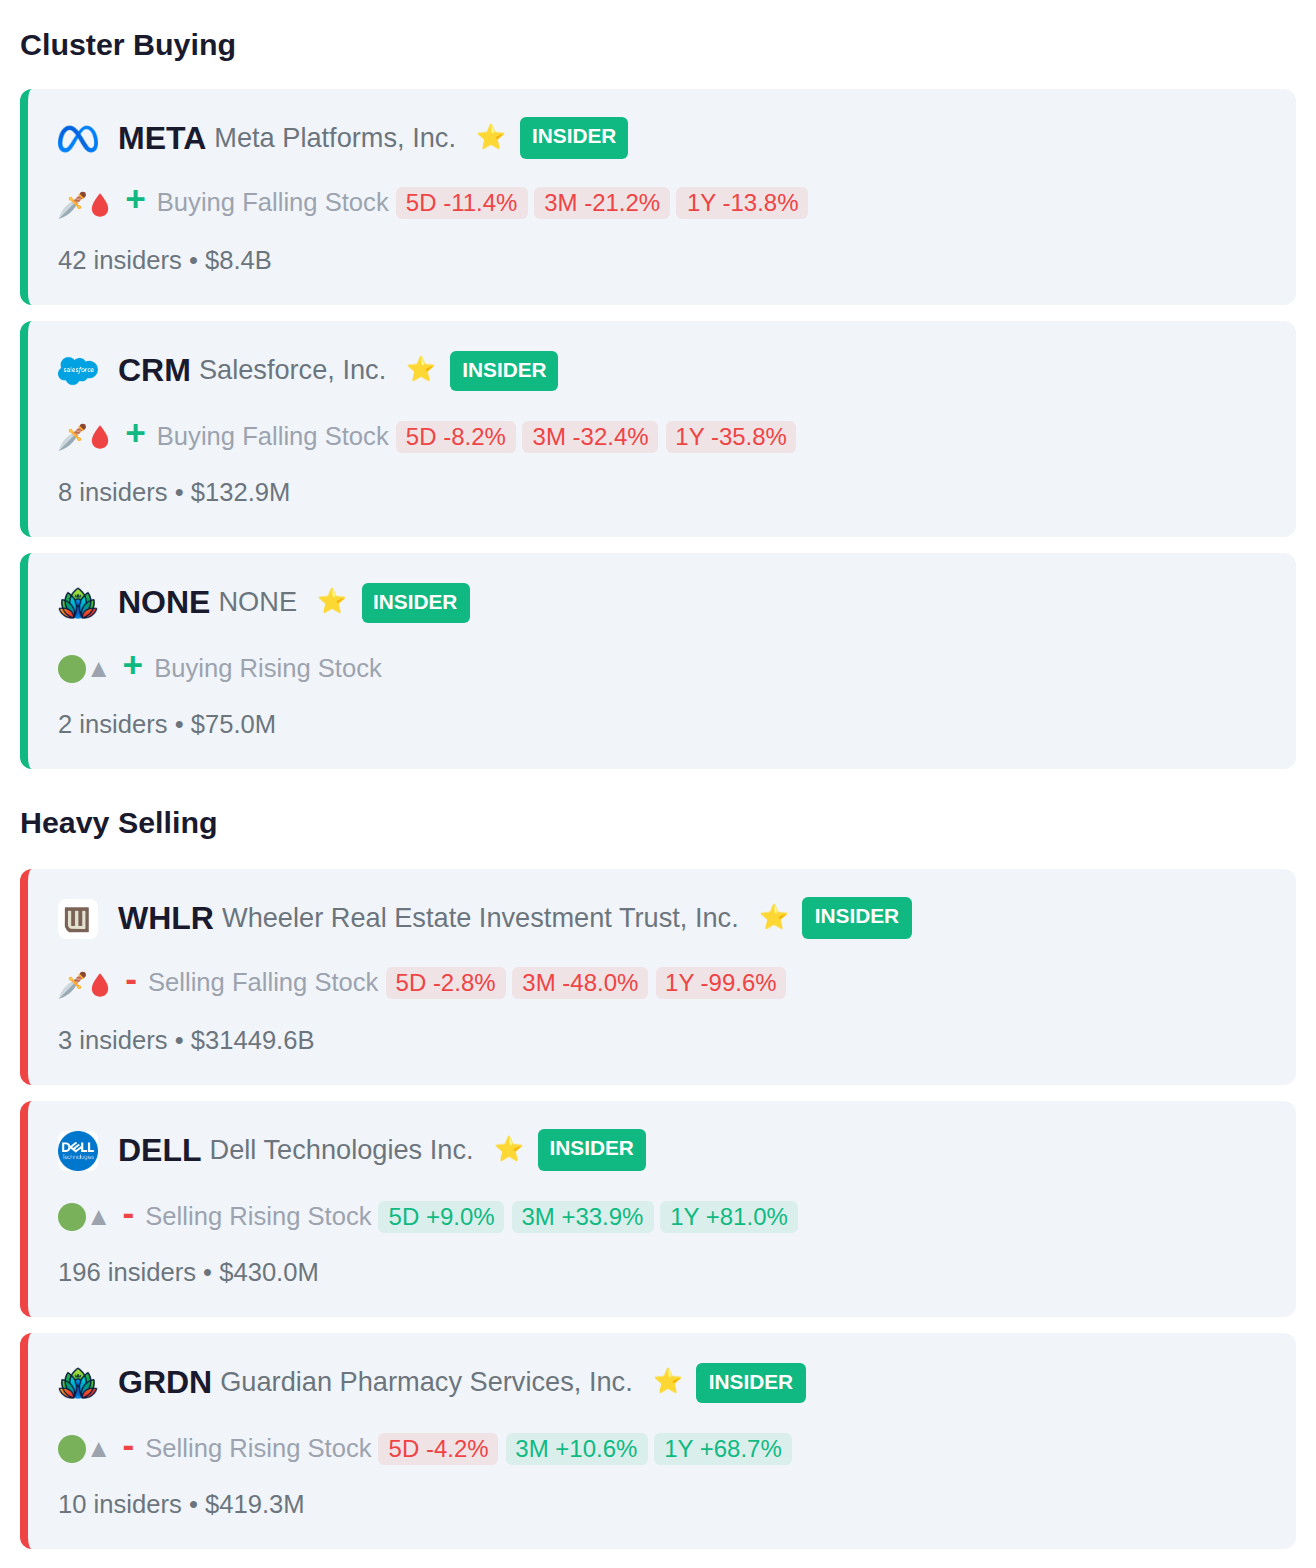
META recorded cluster activity with 42 insiders receiving stock awards, while CRM saw 8 insiders add positions through similar compensation-based transactions. On the distribution side, DELL reported the largest cluster with 196 insiders selling approximately $430 million in shares, followed by GRDN with 10 insiders reducing positions totaling $419.3 million.
Today's earnings calendar includes 312 reporting companies, with accumulation signals observed in PTBA.JK and 3988.HK ahead of their results, while distribution patterns emerged in TLKM.JK and BRPT.JK. Yesterday's session saw significant price movement led by 601869.SS surging 26.5%, contrasting with notable declines in AIRYY down 23.0% and NWWCF falling 18.8%. Smart money positioning shows contrasting flows into and out of these reporting companies as institutional participants adjust positions ahead of earnings releases.