InsiderStreet.ai

The Edge

Know What They Know

April 02, 2026
*Not investment advice
🔥 PRE MARKET MOVERS
Pre-Market Session • 07:00 ET • $0.0T Total Volume
Heatmap

🐷 PIG ROAST

MU+8.9%fool.com: Nvidia's Vera Rubin dreams name-drop MU as AI chip enabler—memory nerds surge 8.9% on +283% 1Y rocket fuel, YTD +7.1% just warming up.
INTC+8.8%fool.com: Intel bets big on AI inference muscle and SambaNova stake—stock pops 8.8% amid +94% 1Y glory, YTD +12% laughs at money outflow signals.
LITE+8.8%invezz.com: AI optics frenzy and hyperscaler cash flood LITE to +8.8%, riding +1023% 1Y monster wave, YTD +82% ignores money fleeing.
WDC+10.1%finbold.com: Memory beast WDC snags AI storage glory with +568% 1Y rampage, today's 10.1% pop reminds suckers it's no one-hit wonder, YTD +44%.
STX+8.0%seekingalpha.com: HAMR tech turns supply chain kink into gold—STX jumps 8% on +365% 1Y tear, YTD +36% shrugs off memory sector bruises.
NKE-15.5%EARNINGS (2026-03-31): EPS beat, rev beat but stock craters 15.5% to new 52-week low—analysts dunk price targets, YTD -16% proves Swoosh can't outrun consumer blues.
RH-19.3%EARNINGS (2026-03-31): EPS miss, rev miss tanks luxury furniture dreams 19.3%, YTD -28% and 1Y -41% scream rich folks skipped the sofa splurge.
AXTI-17.3%fool.com: CEO dumps $1.4M shares, spooks holders—AXTI plunges 17% despite +3506% 1Y moonshot, YTD +105% false hope flickering.
COGT-8.4%globenewswire.com: NDA filing for GIST drug? Investors yawn, dump 8.4% off +494% 1Y beast—COGT's biotech hype hits speed bump, YTD +11% meh.
LW-8.9%EARNINGS (2026-04-01): EPS miss despite rev beat sends french fry king sliding 8.9%, YTD flat at +0.7% but 1Y -20% confirms spud slump.

💬 Word on the Street

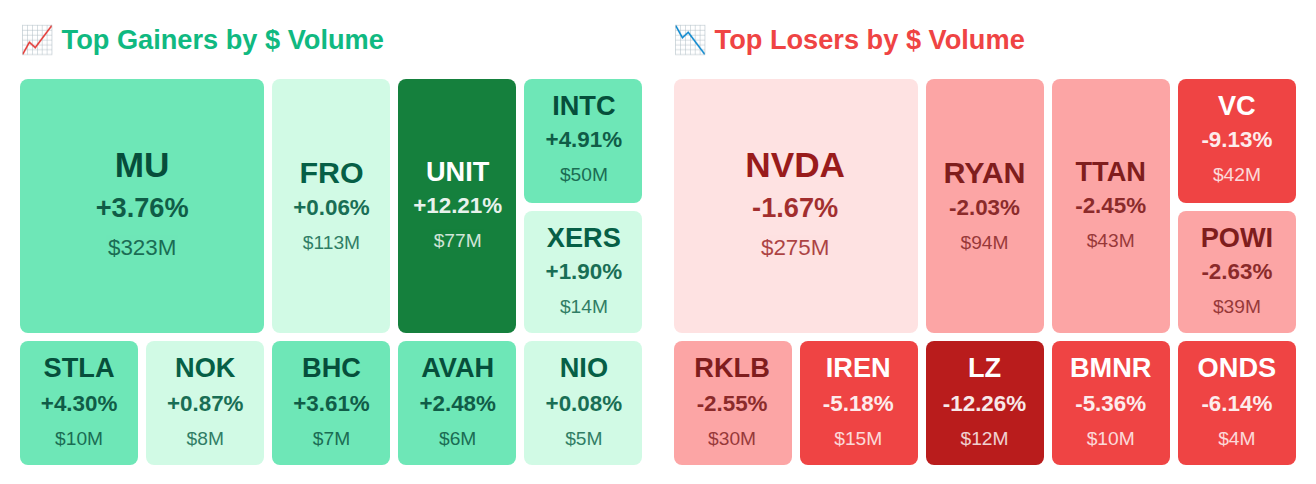
While Rep. Tim Moore purchased Cracker Barrel Old Country Store (CBRL) shares worth up to $50,000, insiders at Garde Capital (GRDN) stampeded for the exits with $419.3 million in sales—and that's before the real fireworks started after hours. Nvidia's (NVDA) new Vera Rubin platform sent Micron Technology (MU) rocketing 8.9% higher while Intel (INTC) and Lumentum Holdings (LITE) both surged 8.8% on AI infrastructure bets, all as the VIX spiked 17.1% and institutions poured $6.6 billion net into equities. Here's what smart money is doing today.

30
Accumulation
0
Distribution
📈 20.5%
SPY Strength
😱 30.6 ↑
VIX
💧 $6.66T ↑
Fed Liquidity
💰 $8.9B
Smart Money Buying
💸 $2.3B
Smart Money Selling
📈 $6.6B
Net Inflow

📚 Jargon Buster

Average Hourly Earnings

How fast paychecks are growing. If wages > inflation, workers win. If not, welcome to serfdom.

🎯 SMART MONEY CONVERGENCE
SMART MONEY CONVERGENCE
😱 VOLATILITY & FEAR

Equity market volatility signals heightened investor anxiety, with the VIX climbing 17.1% over the past week to reach 30.61, a level indicating elevated fear and uncertainty in stock markets. In contrast, bond market volatility as measured by the MOVE index declined 19.3% to 11.58, suggesting relative calm in fixed income markets. This divergence between equity and bond volatility presents an unusual market environment where stock investors are pricing in significant turbulence while Treasury markets remain subdued.

Volatility

|| Market Sutra ||

"The deeper the denial, the harsher the reckoning."

— China Evergrande investors ignored debt risks for a decade

📊 MARKET REGIME

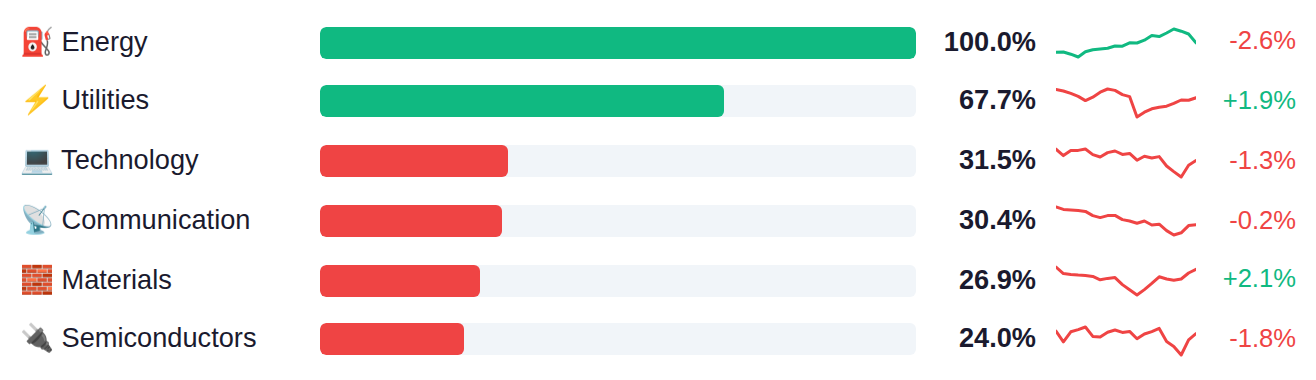
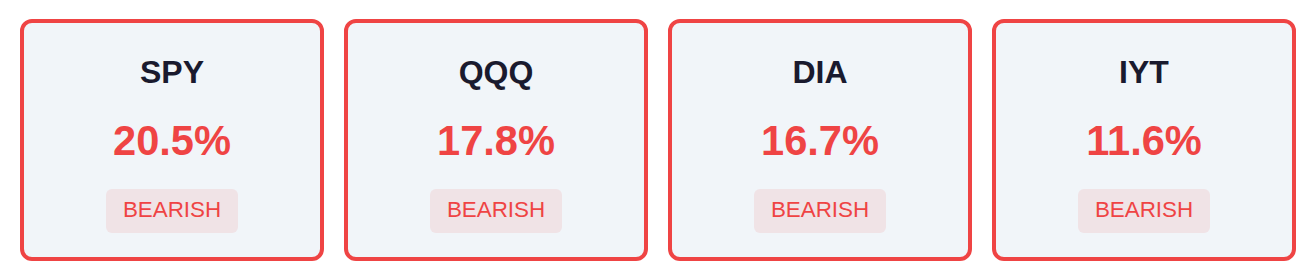
The current market regime shows defensive positioning with Energy leading at 100% breadth followed by Utilities at 68%, while cyclical sectors like Financials, Industrials, and Real Estate register near-zero participation. Major indices display uniformly weak breadth, with SPY at 20%, QQQ at 18%, and DIA at 17%, indicating a narrow market where only select sectors are advancing. This configuration reflects a flight to defensive and commodity-linked sectors amid broad weakness across growth and economically-sensitive areas.

Sector Strength
Sector Strength
📈 INDEX BREADTH
Breadth
💧 FED LIQUIDITY
Net Liquidity: $6.66 Trillion
↑ $1.2B WoW

As of March 25, Fed net liquidity stands at $6.66 trillion, up $1.2 billion from the prior week, indicating a modest expansion in system-wide liquidity that historically correlates with supportive conditions for risk assets. The next H.4.1 data release drops Thursday, April 2, which will show whether this gradual liquidity increase continues or reverses.

📅 ECONOMIC CALENDAR Surprise Index: +3.7

Yesterday's data painted a picture of resilient consumer spending despite elevated borrowing costs, with retail sales rising 0.5% versus 0.3% expected while mortgage rates climbed to 6.57% from 6.43% the prior week. The strength in consumer activity stands in stark contrast to softer labor indicators, as ADP's 62K private payroll gain and manufacturing employment holding below the 50 breakeven threshold at 48.7 suggest underlying weakness in hiring trends—a divergence that typically precedes broader economic slowdowns. Today's focus shifts to initial jobless claims (estimated at 212K) and the trade balance, followed by tomorrow's critical nonfarm payrolls report where economists expect just 60K jobs added after February's striking -92K decline, which would mark the weakest three-month stretch since the pandemic if realized.

Yesterday — Wednesday, April 01
14 events · 7 beats · 2 misses
11:00MBA 30-Year Mortgage Rate (Mar/27) 6.57% vs None% est
12:15ADP Employment Change (Mar) 62.0K vs 40.0K est
12:30Retail Sales YoY (Feb) 3.7% vs 2.9% est
12:30Retail Sales Ex Autos MoM (Feb) 0.5% vs 0.3% est
12:30Retail Sales Ex Gas/Autos MoM (Feb) 0.4% vs 0.2% est
12:30Retail Sales MoM (Feb) 0.5% vs 0.3% est
14:00ISM Manufacturing Employment (Mar) 48.7 vs 48.6 est
14:00ISM Manufacturing PMI (Mar) 52.7 vs 52.5 est
14:00Business Inventories MoM (Jan) -0.1% vs 0.1% est
14:30EIA Gasoline Stocks Change (Mar/27) -0.585M vs -1.9M est
14:30EIA Crude Oil Stocks Change (Mar/27) 5.451M vs 0.8M est
15:30Atlanta Fed GDPNow (Q1) 1.9% vs 2.0% est
Today — Thursday, April 02
14 events · 14 upcoming
01:00US President Trump Speech Pending
12:30Imports (Feb) est 364.0B / prev 356.6B
12:30Imports prev 356.6B
12:30Balance of Trade prev -80.8B
12:30Jobless Claims 4-Week Average (Mar/28) est 214.0 / prev 210.5
12:30Balance of Trade (Feb) est -59.2B / prev -54.5B
12:30Initial Jobless Claims (Mar/28) est 212.0K / prev 210.0K
12:30Exports (Feb) est 304.0B / prev 302.1B
12:30Goods Trade Balance (Feb) est -84.0B / prev -80.8B
12:30Goods Trade Balance Adv (Feb) est -84.0B / prev -80.8B
12:30Continuing Jobless Claims (Mar/21) est 1840.0K / prev 1819.0K
15:00Fed Logan Speech Pending
15:30Atlanta Fed GDPNow (Q1) prev 1.9
16:45Fed Bowman Speech Pending
Tomorrow — Friday, April 03
18 events · 9 high impact
08:00ISM Non-Manufacturing Employment (Mar) prev 51.8
08:00ISM Non-Manufacturing Prices (Mar) prev 63.0
08:00ISM Non-Manufacturing PMI (Mar) prev 56.1
12:30Non Farm Payrolls (Mar) est 60.0K / prev -92.0K
12:30Average Hourly Earnings YoY (Mar) est 3.8% / prev 3.8%
12:30Unemployment Rate (Mar) est 4.4% / prev 4.4%
12:30U-6 Unemployment Rate (Mar) est 8.0 / prev 7.9
12:30Nonfarm Payrolls Private (Mar) est 73.0K / prev -86.0K
12:30Participation Rate (Mar) est 62.3 / prev 62.0
12:30Average Hourly Earnings MoM (Mar) est 0.3% / prev 0.4%
14:00ISM Services PMI (Mar) est 54.0 / prev 56.1
14:00ISM Non-Manufacturing PMI (Mar) prev 56.1
14:00ISM Non-Manufacturing Prices (Mar) prev 63.0
14:00ISM Non-Manufacturing Employment (Mar) prev 51.8
19:30CFTC Crude Oil speculative net positions prev 233.6K
19:30CFTC Gold Speculative net positions prev 168.3K
19:30CFTC Nasdaq 100 speculative net positions prev 6.6K
19:30CFTC S&P 500 speculative net positions prev -80.9K
🏦 INSTITUTIONAL FLOW

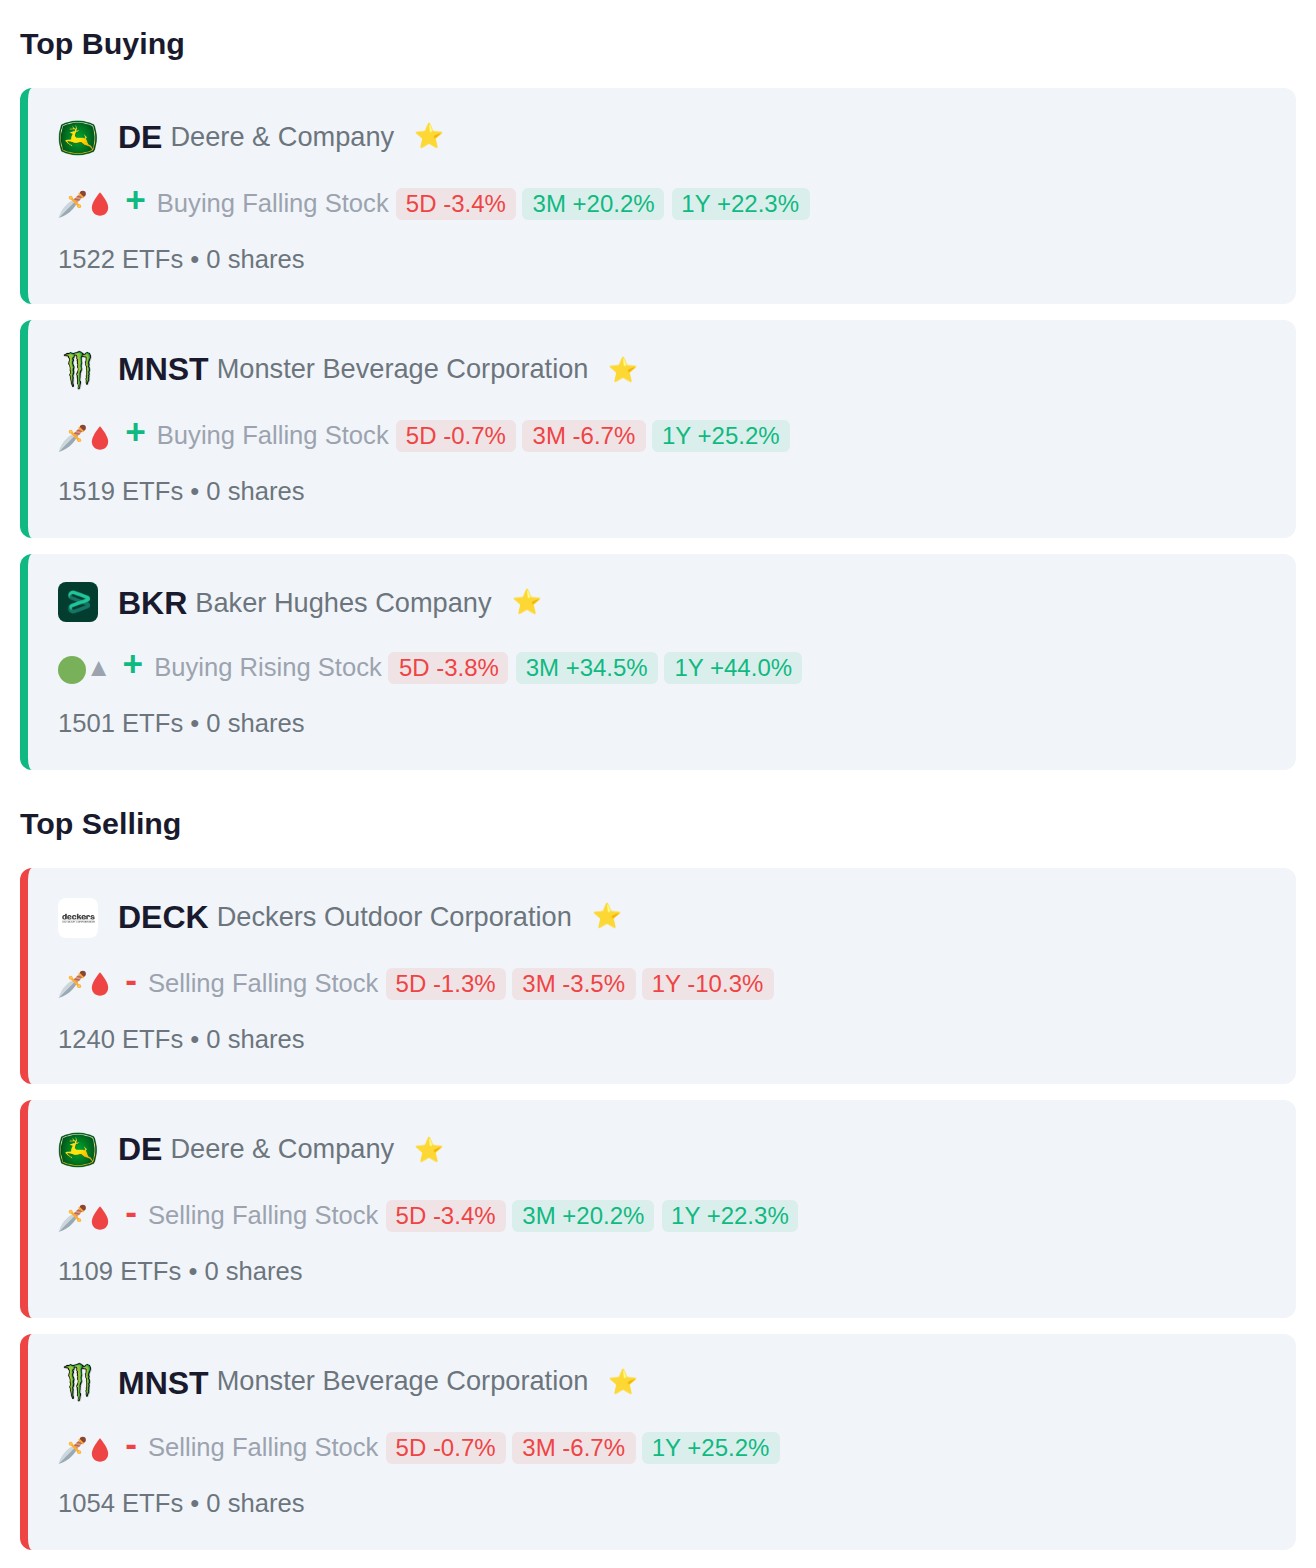
Exchange-traded funds displayed mixed positioning across industrial and consumer sectors, with 1,522 ETFs adding Deere & Company (DE) exposure while 1,109 simultaneously reduced it, suggesting rotation within agricultural and machinery holdings rather than directional conviction. Monster Beverage (MNST) saw similar two-way flows with 1,519 ETFs increasing and 1,054 decreasing positions, while energy services name Baker Hughes (BKR) attracted 1,501 new ETF positions against Deckers Outdoor's (DECK) 1,240 exits from footwear and apparel allocations.

INSTITUTIONAL FLOW
🏛️ CONGRESSIONAL TRADES

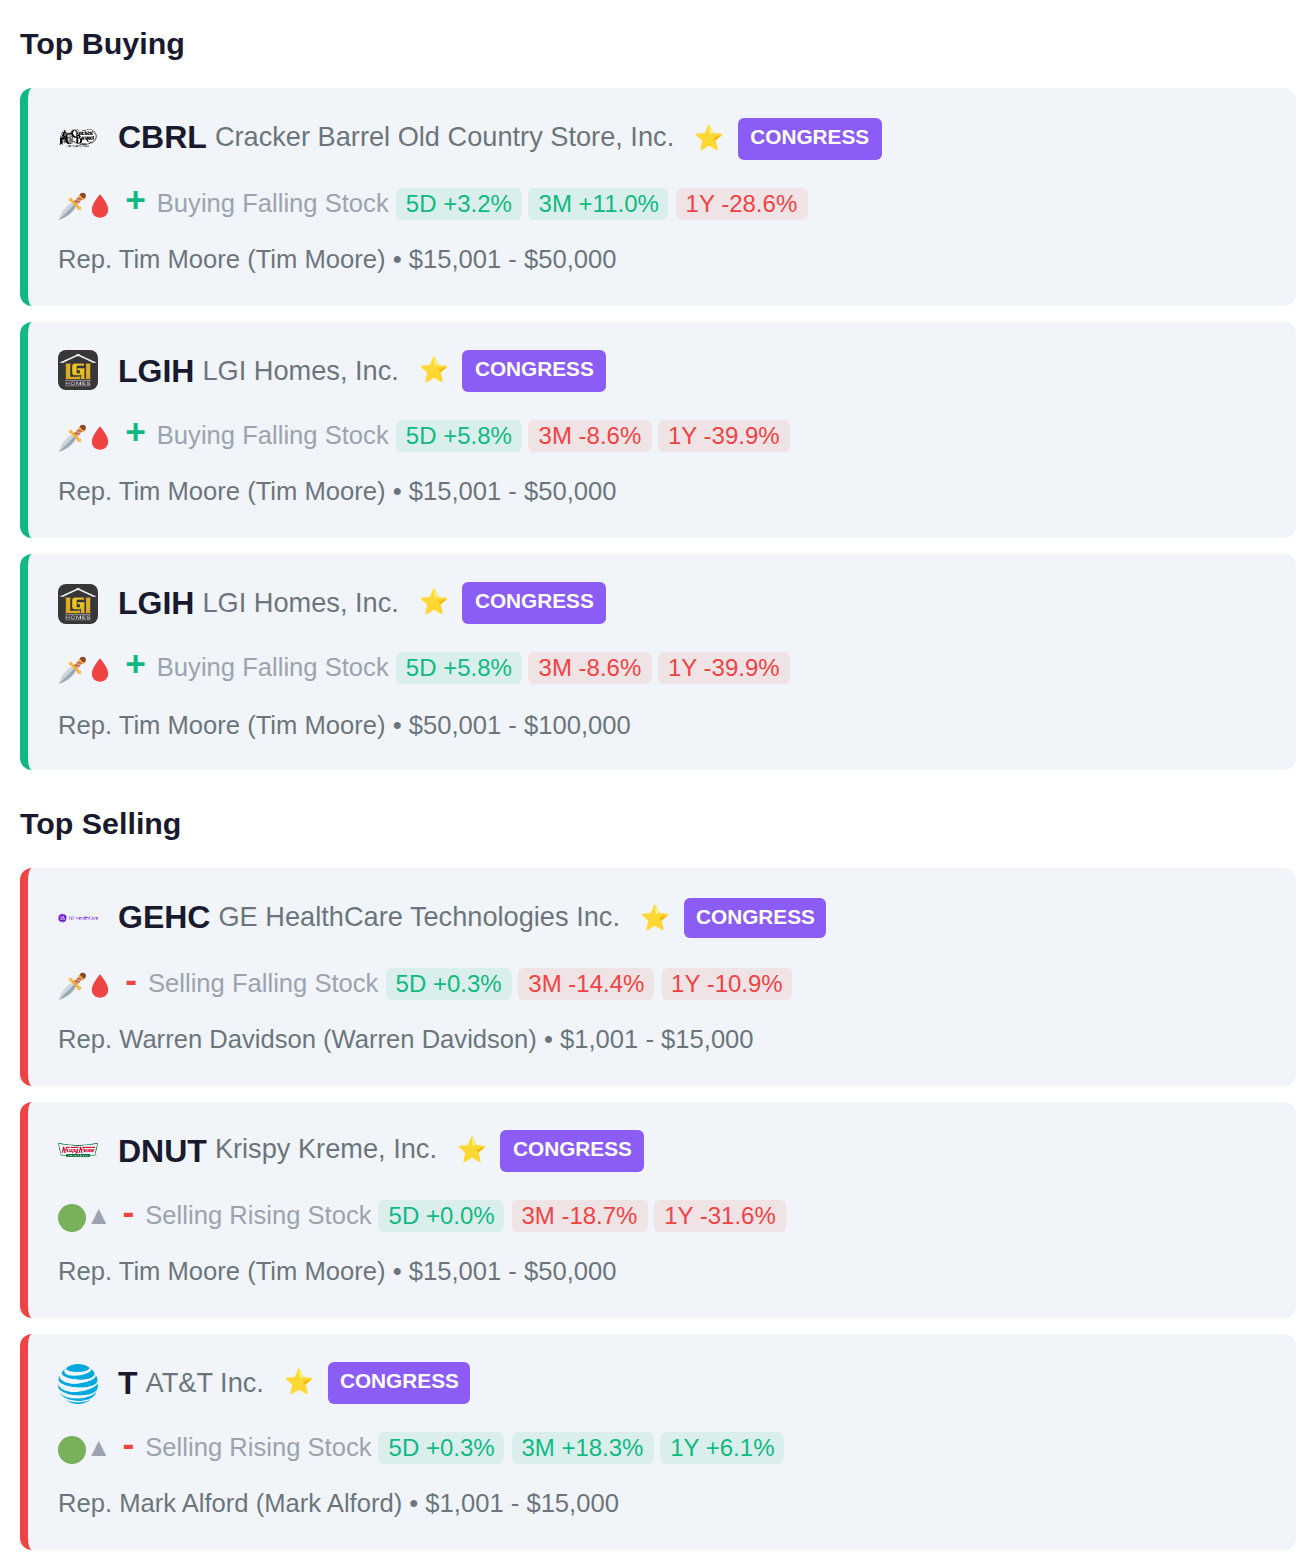
Rep. Tim Moore made multiple purchases in LGIH and CBRL while selling DNUT, demonstrating concentrated buying activity in the homebuilding and restaurant sectors. Other congressional members reduced positions across healthcare equipment (GEHC) and telecommunications (T), with selling activity outnumbering purchases when accounting for Moore's duplicate LGIH transactions.

CONGRESSIONAL TRADES
👔 INSIDER ACTIVITY

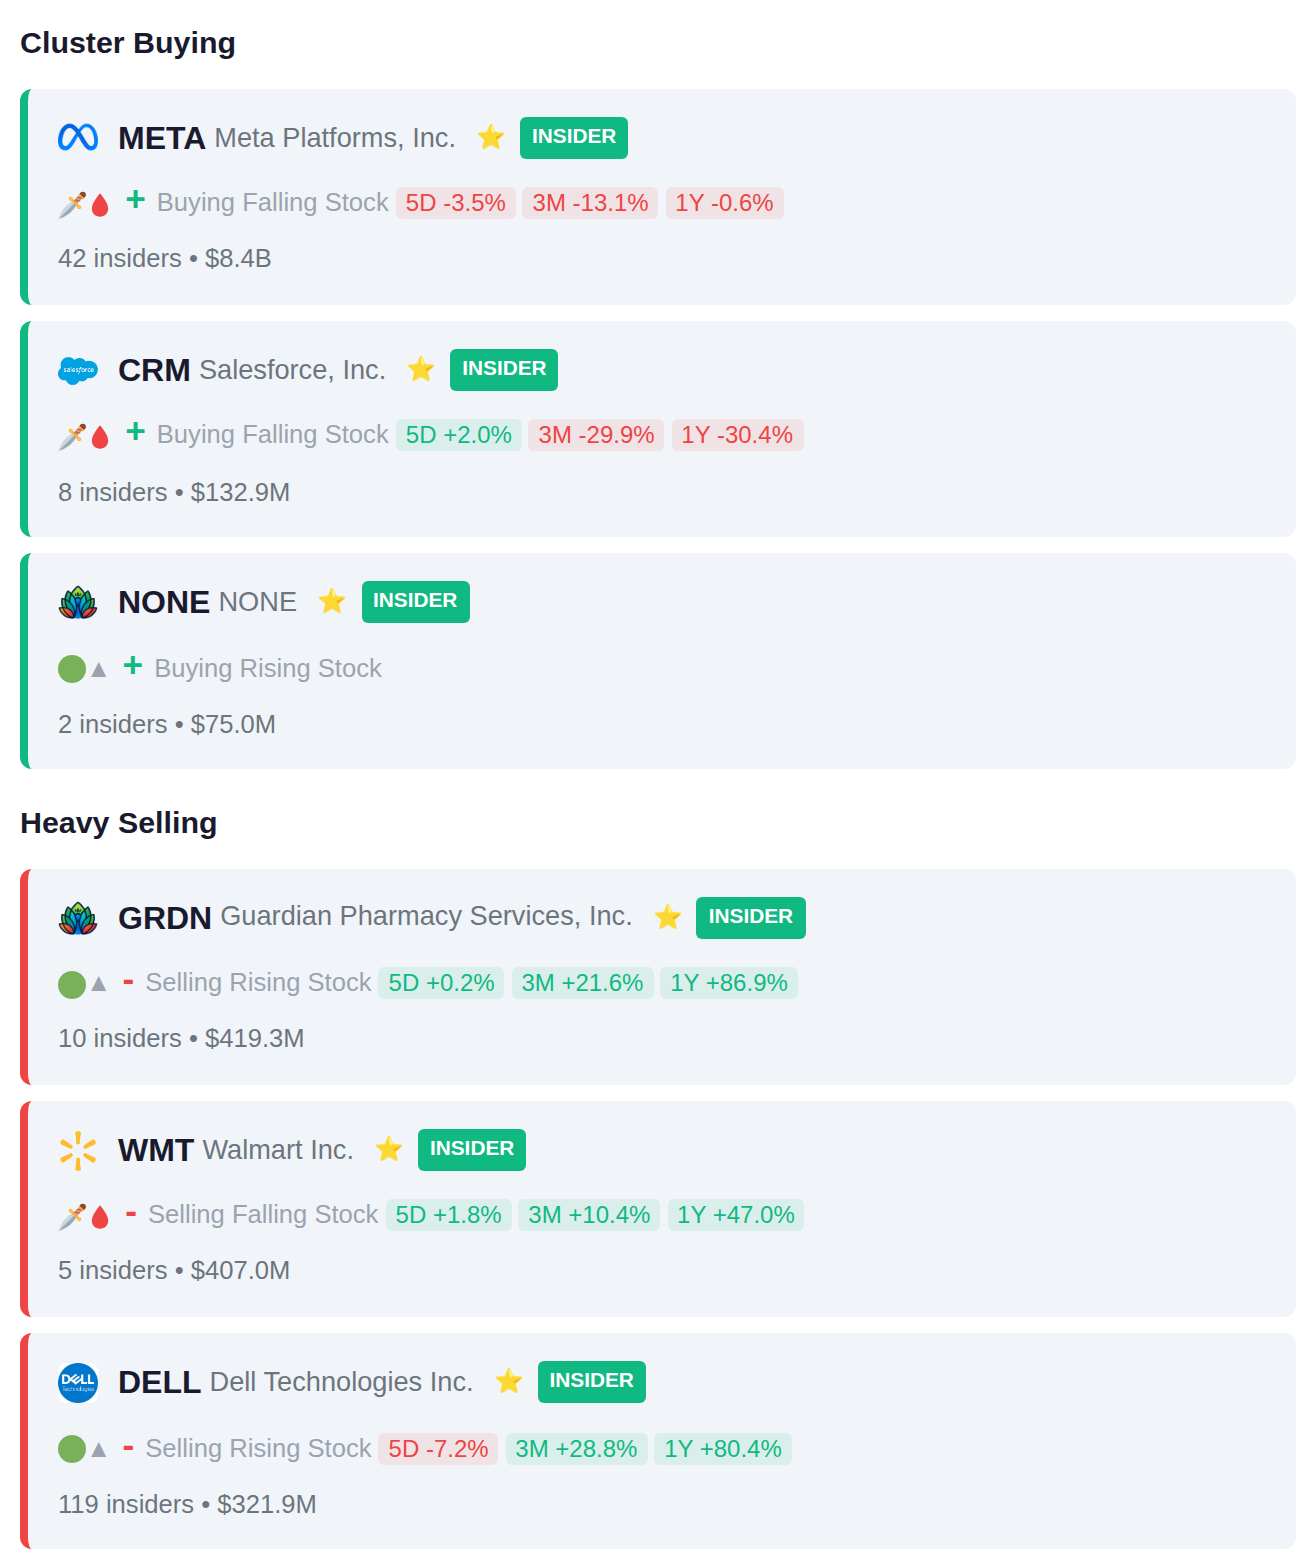
META saw concentrated award activity with 42 insiders receiving equity compensation, while CRM recorded 8 insider purchases during the period. On the distribution side, DELL led with 119 insiders offloading $321.9M in shares, followed by GRDN's 10 insiders selling $419.3M and WMT's 5 insiders disposing of $407.0M in stock.

INSIDER ACTIVITY
📅 EARNINGS CALENDAR

Today's earnings calendar features 25 companies reporting results, with recent smart money activity showing accumulation in 601200.SS and TERN ahead of their announcements, while institutional investors have been reducing positions in 3549.T and MGNT.ME. This earnings slate follows notable momentum in yesterday's session, where NG surged 11.1%, MAPI.JK gained 9.1%, and JHSF3.SA advanced 7.2%.

25 reporting todayFull earnings breakdown →
This is just the highlights
Full report: All convergence signals • Complete sector breakdown • Full volatility dashboard • Detailed earnings • Complete AI analysis
READ FULL NEWSLETTER →