The Edge
Know What They Know
🐷 PIG ROAST
💬 Word on the Street
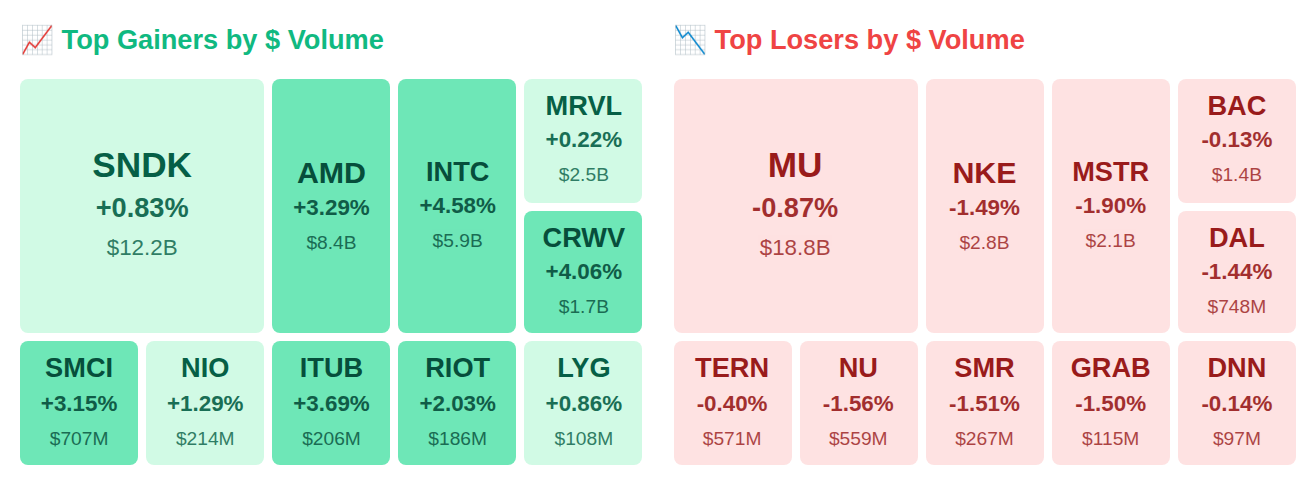
While the VIX spiked 17.1% to 30.6 and ten insiders at Guardant Health (GRDN) dumped $419.3 million worth of stock, Rep. Tim Moore scooped up $15,001 to $50,000 in Cracker Barrel Old Country Store (CBRL)—and institutional players poured in a net $7.9 billion across the market as if they know something the panic-sellers don't. After hours, Applied Optoelectronics (AAOI) exploded 20% on $124 million in data center orders while Lumentum Holdings (LITE) quietly surged 8% despite the chaos, and the Fed quietly injected $1.2 billion in fresh liquidity into the system. Here's what smart money actually did with their capital today.
📚 Jargon Buster
Atlanta Fed GDPNow
The Fed’s real-time guess at GDP. Moves markets more than it should because everyone’s addicted.
Equity volatility has surged into high-fear territory with the VIX climbing 17.1% week-over-week to reach 30.61, signaling heightened uncertainty in stock markets as traders price in elevated risk. This stands in stark contrast to bond market volatility, where the MOVE index dropped 22.2% to 11.51, indicating relative calm in fixed income markets. The divergence between elevated equity volatility and subdued bond volatility suggests investors are anticipating stock-specific turbulence while viewing Treasury markets as comparatively stable.

|| Market Sutra ||
"A thesis without timestamps is a belief, not a strategy."
— Gold bugs predicted hyperinflation for 40 years without timing
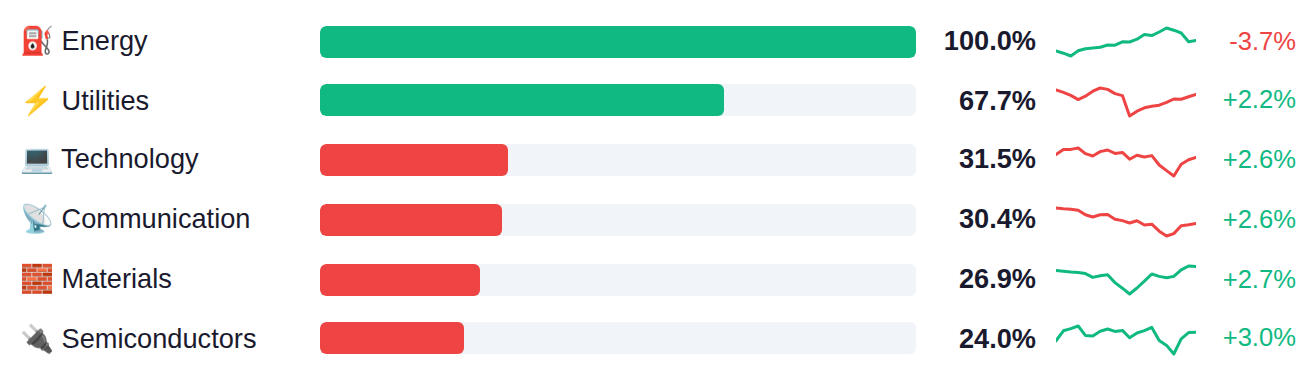
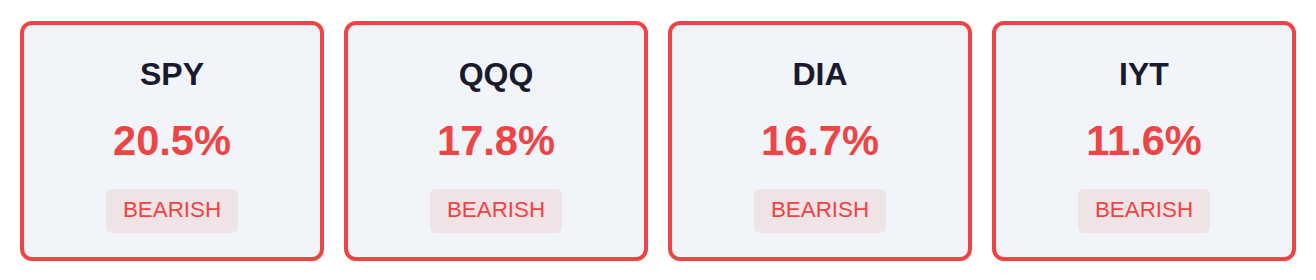
The current market regime shows defensive positioning with Energy, Utilities, and Technology sectors capturing the majority of institutional attention at 100%, 68%, and 32% respectively, while economically sensitive areas like Real Estate, Industrials, and Financials lag significantly at 6% or below. Major index breadth remains narrow across the board, with SPY, QQQ, DIA, and IYT all registering participation rates between 12% and 20%, indicating concentrated leadership rather than broad-based market strength. This combination of defensive sector rotation and weak breadth suggests institutions are positioning cautiously, favoring quality and stability over cyclical exposure.
As of March 25, Fed net liquidity stands at $6.66 trillion, up $1.2 billion week-over-week, indicating a marginal expansion in system liquidity that historically correlates with supportive conditions for risk assets. The next H.4.1 release drops Thursday, April 02, which will show whether this liquidity expansion continues or reverses.
Yesterday's trade data showed exports surging to $314.8B against $304.0B estimates—a substantial $10.8B beat that marked the highest reading in over a year—while the overall trade deficit narrowed less than expected to -$57.3B, offering modest relief from the deteriorating trend seen since late 2024. Initial jobless claims dropped sharply to 202K versus 212K expected, extending the labor market's resilience even as the Atlanta Fed slashed its Q1 GDP nowcast to 1.6% from 1.9%, signaling potential stagflationary headwinds. Today's critical jobs report faces heightened scrutiny with nonfarm payrolls expected to swing dramatically from -92K to positive 60K—a 152K reversal that would snap two consecutive months of job losses—while traders will parse whether wage growth continues decelerating (3.7% YoY expected versus 3.8% prior) and if the participation rate ticks up to 62.3% from 62.0%, which could ease pressure on the unemployment rate even if job creation disappoints.
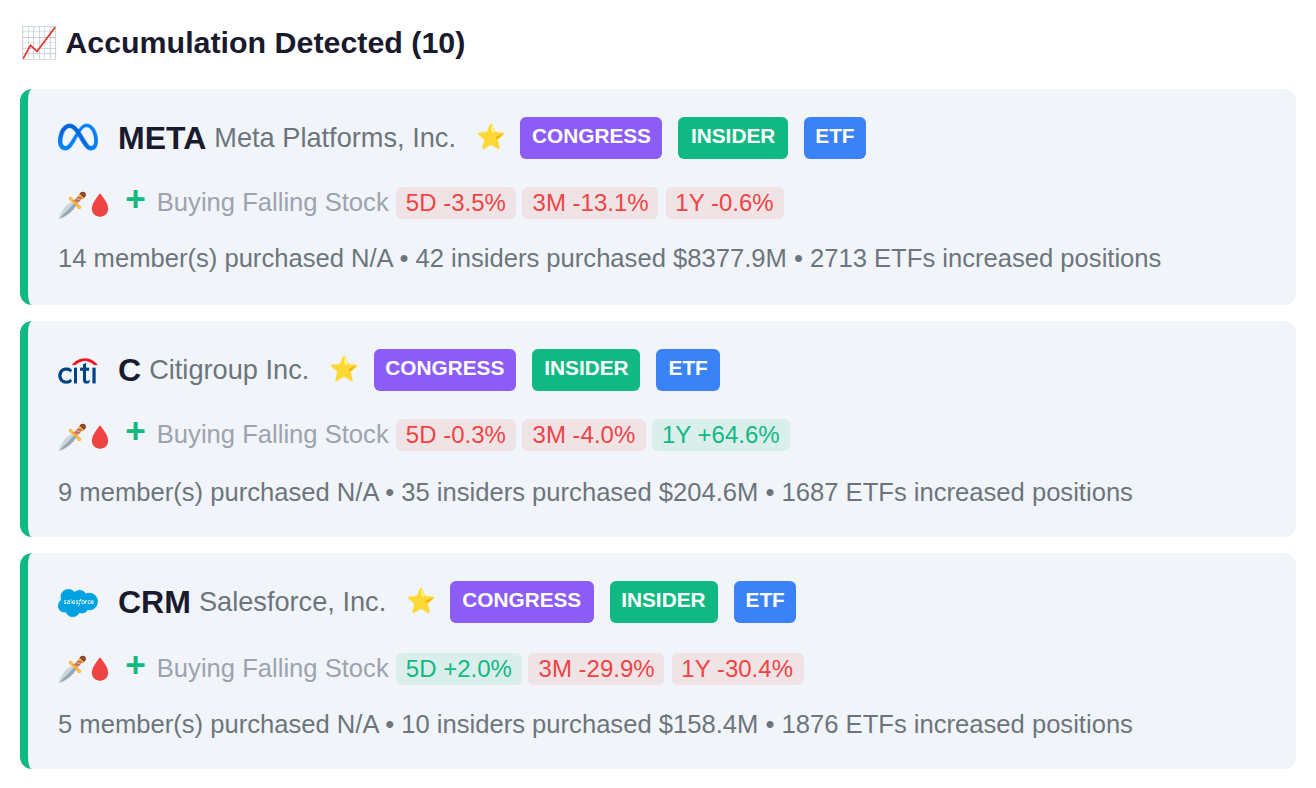
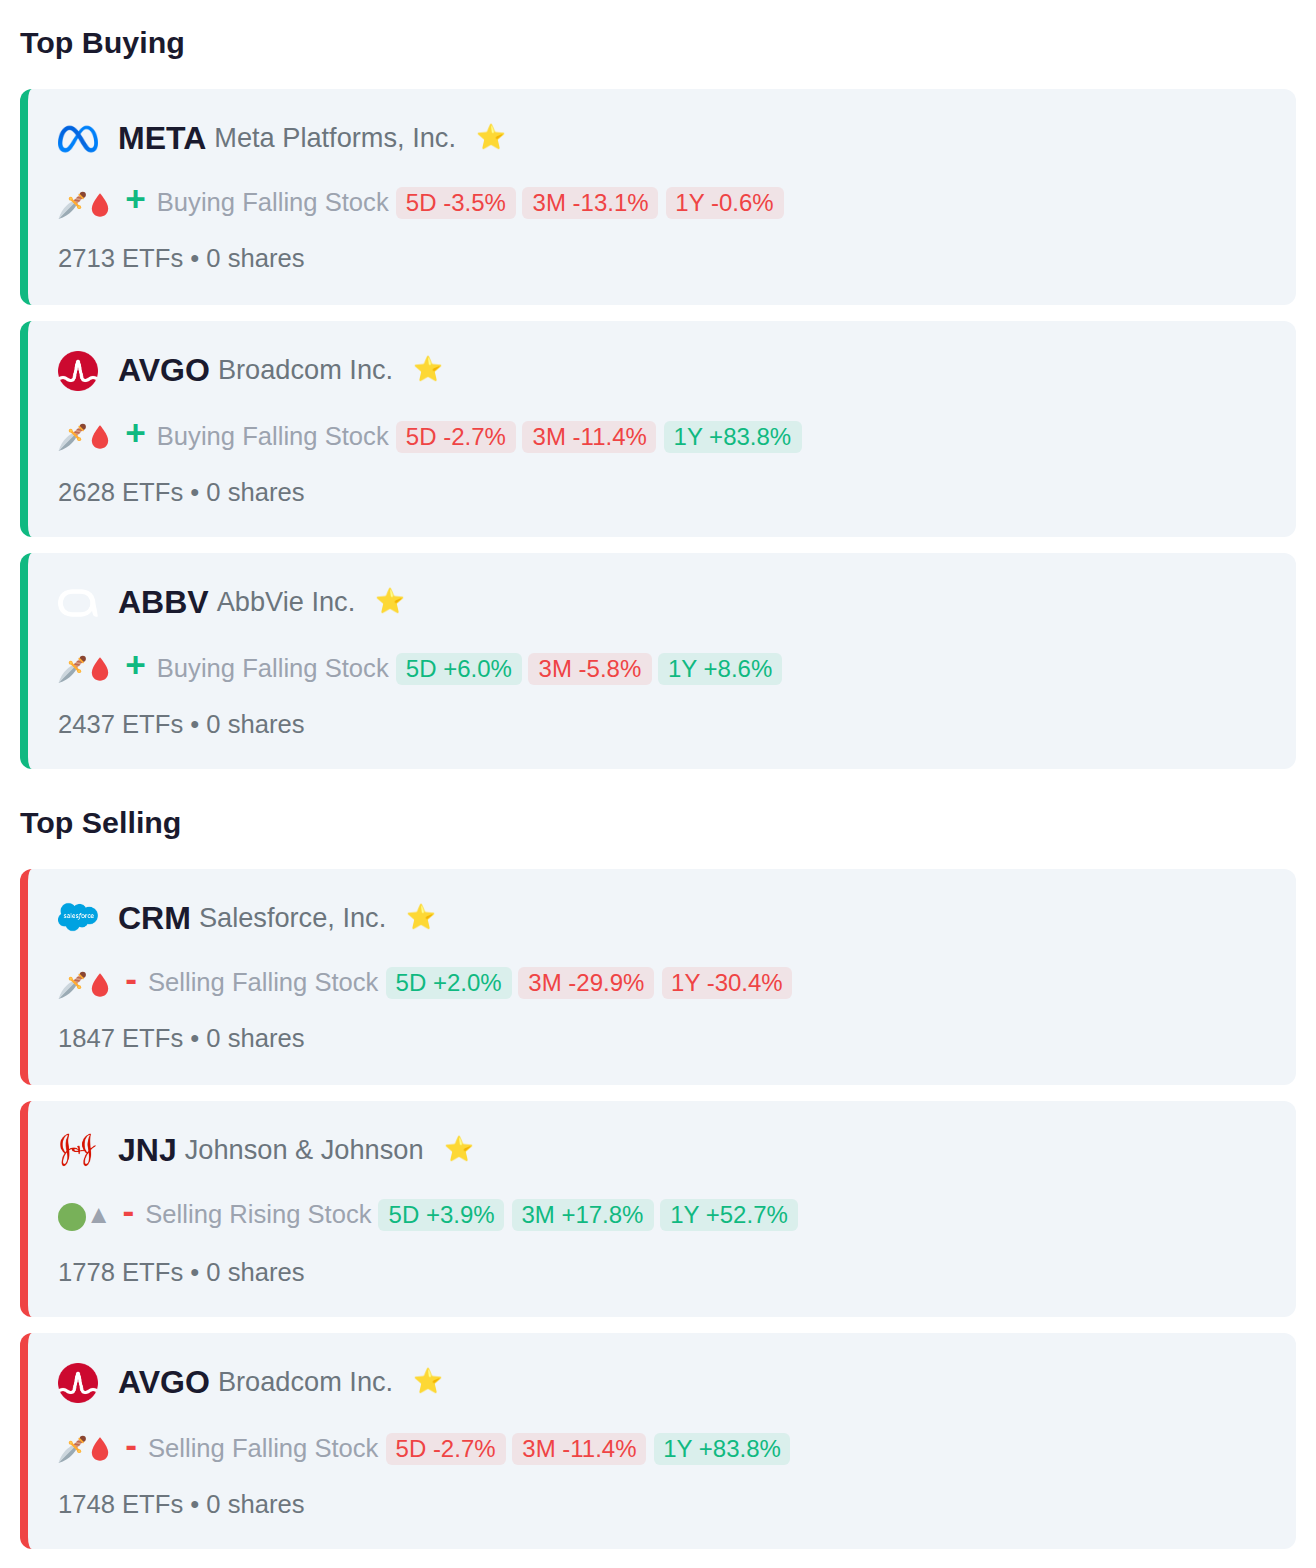
Institutional flows this period show a rotation into big tech and pharmaceuticals, with 2,713 ETFs adding META positions and 2,437 increasing ABBV holdings, while enterprise software faced selling pressure as 1,847 ETFs reduced CRM exposure. AVGO saw mixed activity with simultaneous buying and selling across different fund families, appearing on both the top additions (2,628 ETFs) and top redemptions (1,748 ETFs) lists.
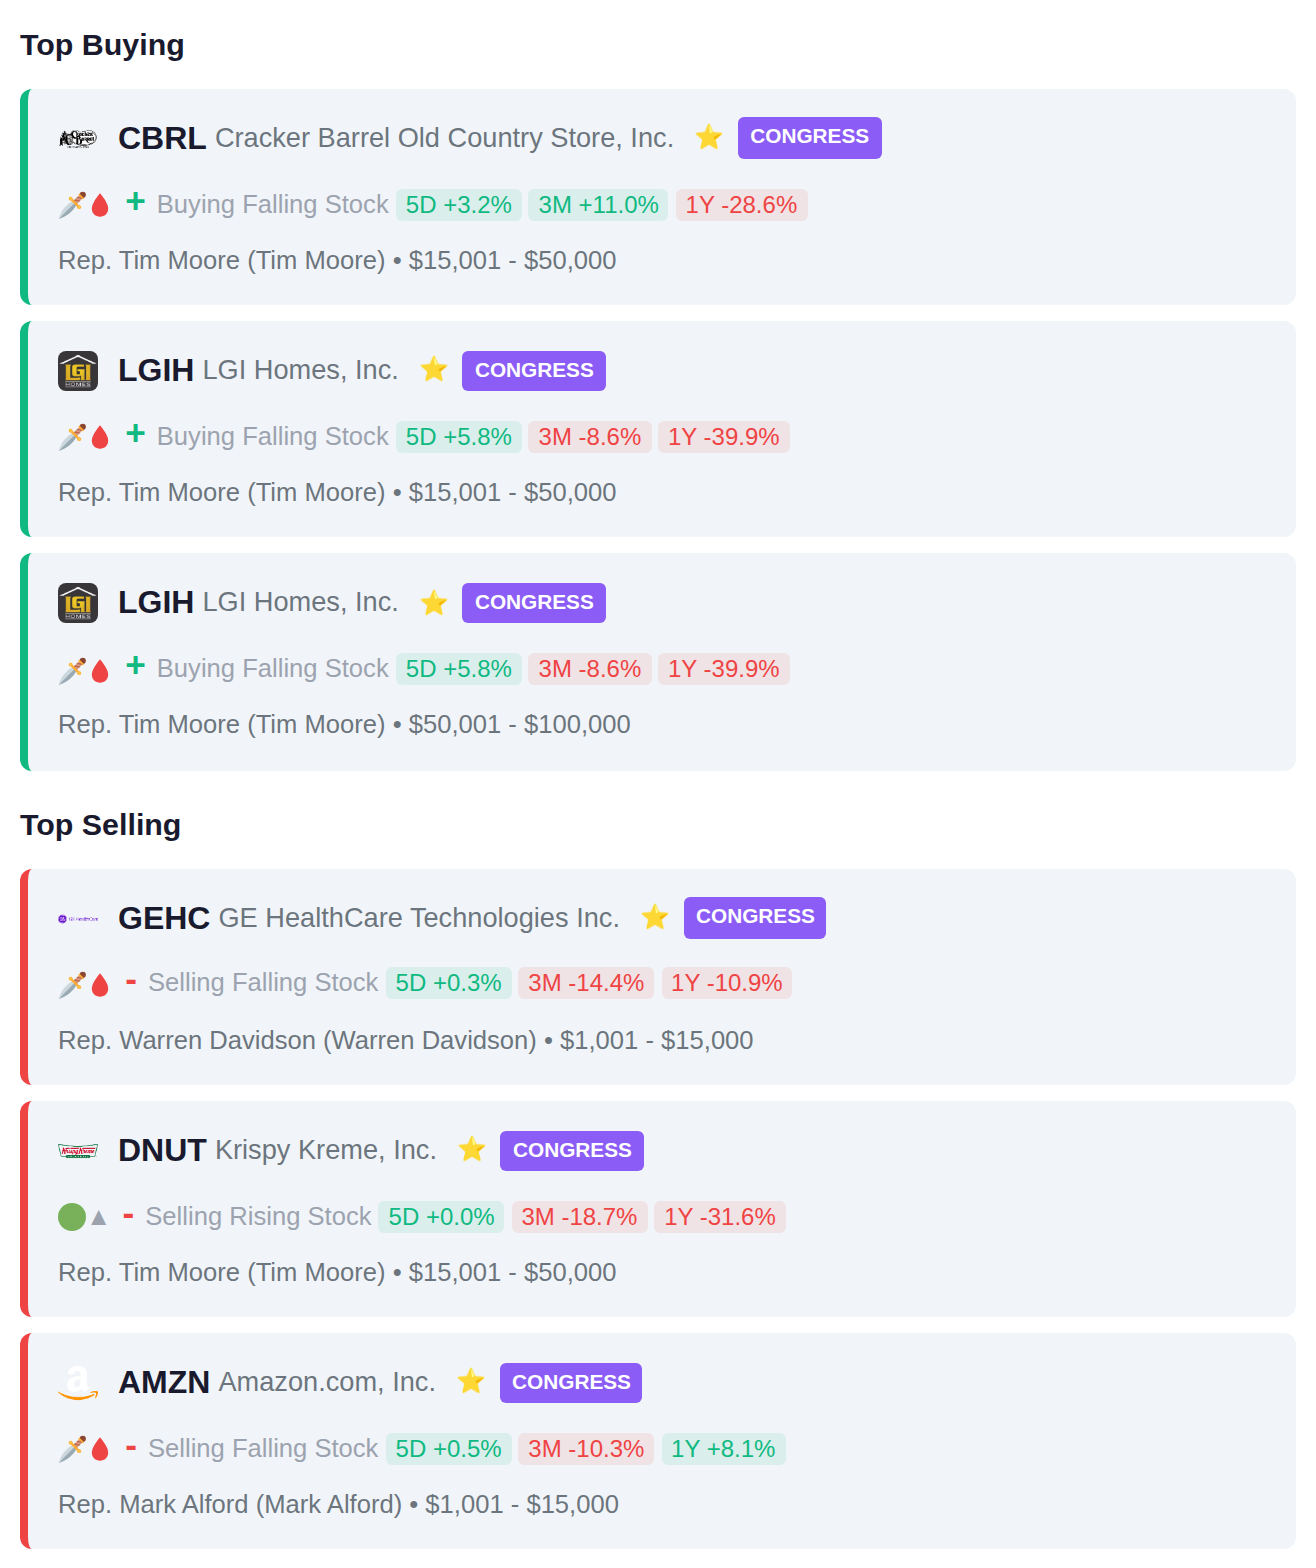
Rep. Tim Moore executed multiple purchases in CBRL and LGIH while selling DNUT, demonstrating concentrated buying activity in the restaurant and homebuilding sectors. Meanwhile, Reps. Warren Davidson and Mark Alford reduced positions in GEHC and AMZN respectively, with no clear sector pattern emerging across the selling activity.
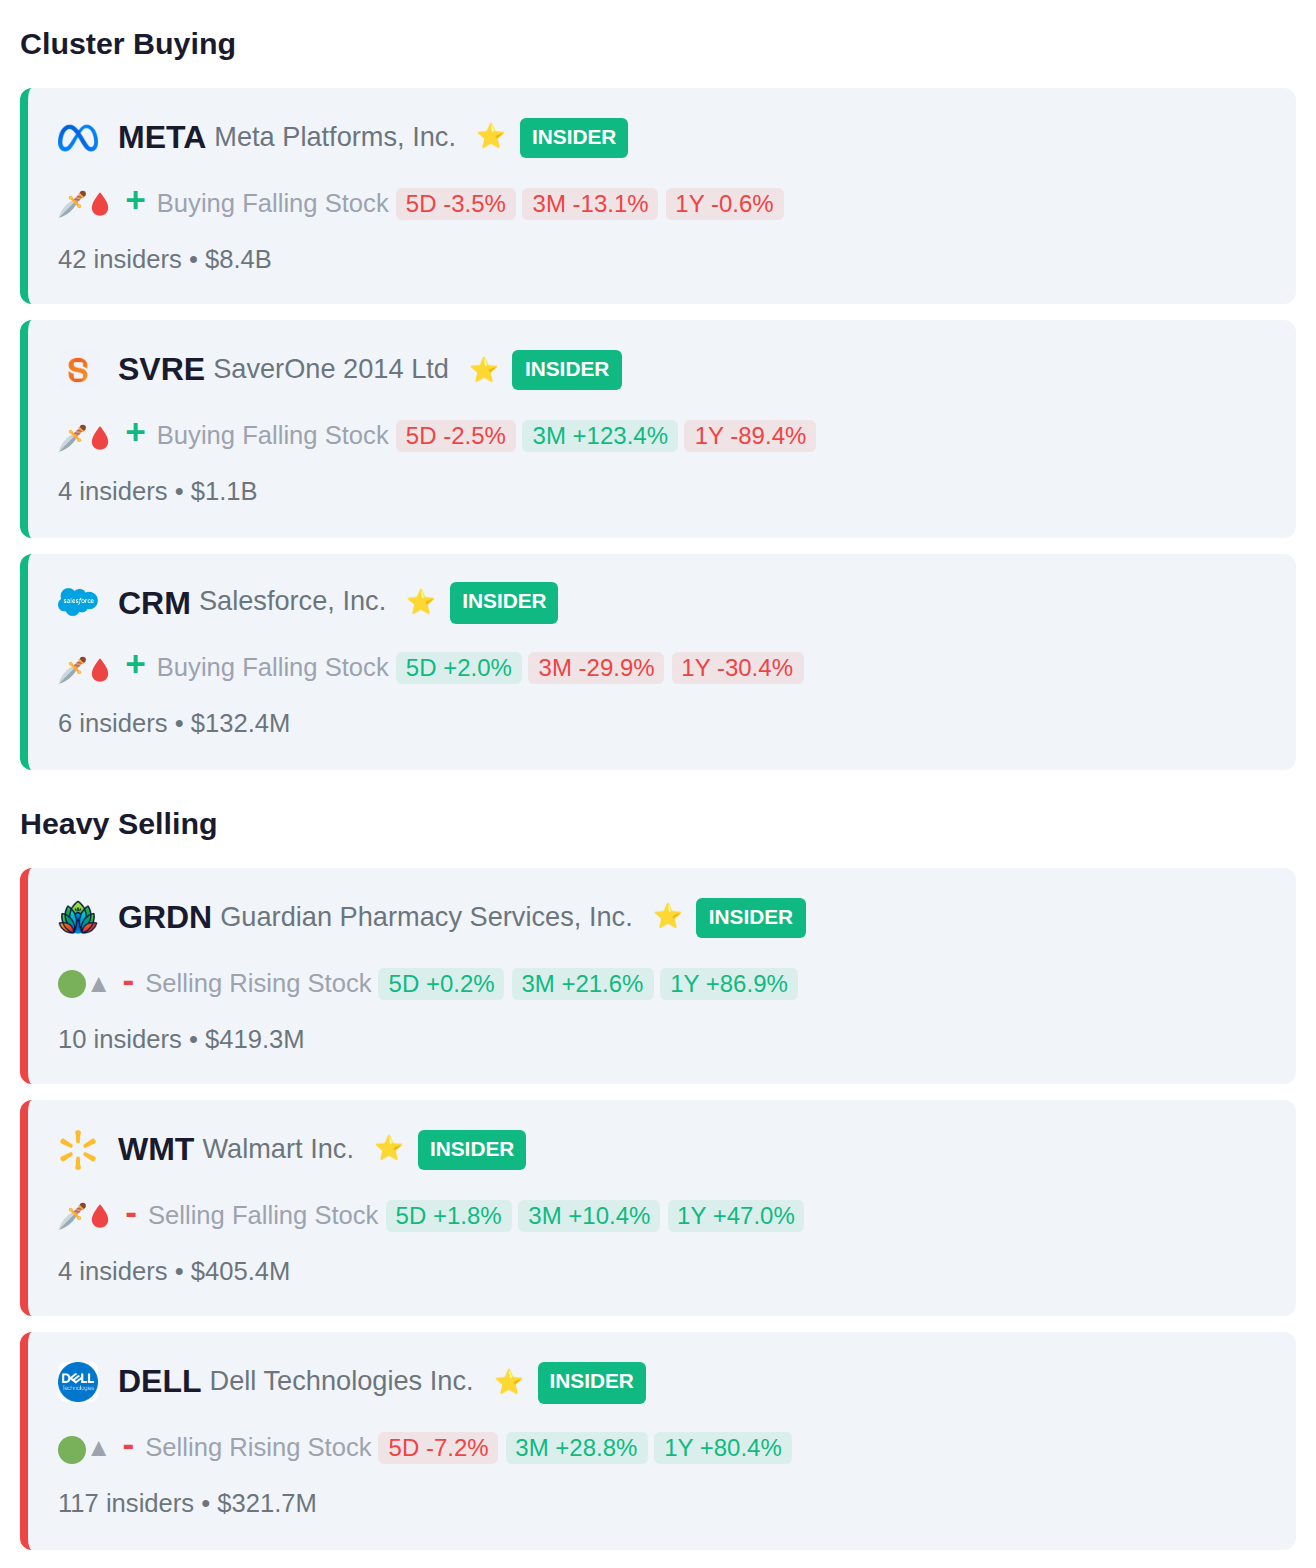
Recent insider filings show concentrated selling activity at GRDN where 10 insiders collectively disposed of $419.3M in shares, WMT where 4 insiders sold $405.4M, and DELL where 117 insiders reduced positions totaling $321.7M. On the purchasing side, META recorded 42 insider transactions involving stock purchases or awards, while CRM and SVRE saw 6 and 4 insiders adding to their positions respectively.
Thirty-seven companies report earnings today, with accumulation signals detected in 001965.SZ and 002422.SZ ahead of their results, while distribution signals appeared in VSMO.ME and 3612.T. Yesterday, TERN gained 5.4% as traders positioned ahead of this week's reporting calendar, which concludes after today's session with no companies scheduled for tomorrow.