The Edge
Know What They Know
🐷 PIG ROAST
💬 Word on the Street
While Rep. David Taylor quietly scooped up shares of Installed Building Products (IBP) and Walmart (WMT) insiders dumped a staggering $405.4 million, the real fireworks happened after the bell where three moonshot stocks ripped higher on everything from crypto-crushing tech infrastructure gains to AI optical fever dreams that have estimates scrambling to catch up. Smart money poured $8.6 billion net into equities today even as the VIX cooled off, and one space stock that's already up 324% over the past year just tacked on another 10% while retail investors pile in like they're chasing the next SpaceX. Here's what smart money is doing today.
📚 Jargon Buster
Retail Sales
How much consumers are swiping. Strong = economy humming. Weak = Amazon packages stop showing up.
Equity volatility remains elevated with the VIX at 24.54, though the 3.1% weekly decline suggests some moderation in investor fear levels from recent peaks. This contrasts sharply with bond market volatility, where the MOVE index dropped 22.2% to 11.51, indicating significantly reduced concern about interest rate movements. The divergence between equity and fixed income volatility metrics suggests investors are pricing in continued uncertainty for stocks while gaining confidence in the stability of the Treasury market.

|| Market Sutra ||
"Hope is the costliest position you can hold."
— Investors holding FTX tokens prayed for recovery until zero
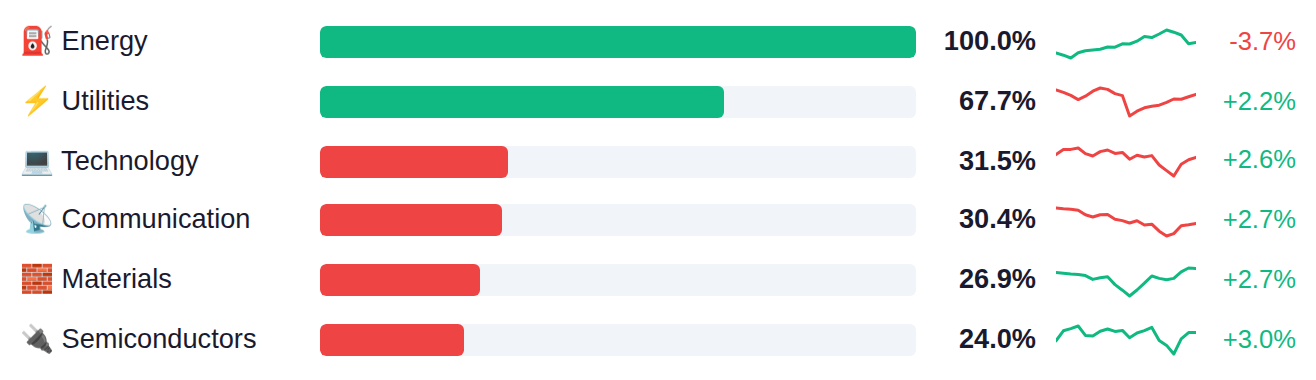
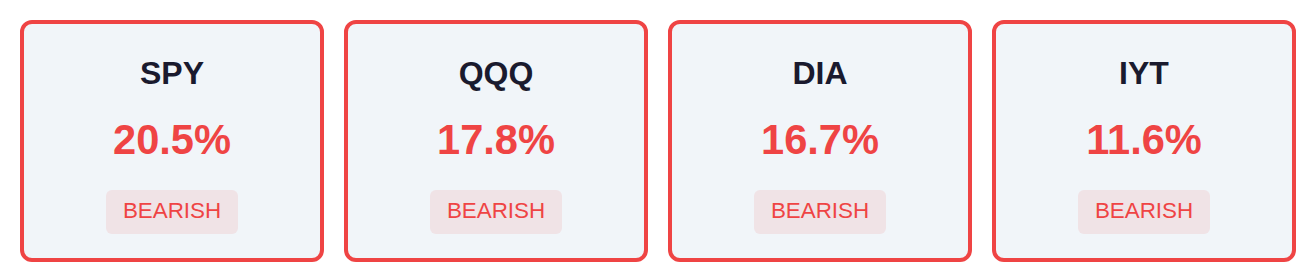
Market breadth remains weak across major indices, with fewer than one in five stocks advancing in the SPY, QQQ, and DIA, suggesting a narrow leadership environment. Energy, Utilities, and Technology are capturing the majority of relative strength while defensive positioning appears evident given Real Estate and Financials lag significantly at 6% and 0% respectively. The concentration in traditionally defensive sectors like Utilities alongside Energy, combined with severely limited index participation, indicates investors are rotating into selective pockets rather than participating in broad-based risk-taking.
As of April 1, Fed net liquidity stood at $6.68 trillion, up $18.2 billion week-over-week, with the next H.4.1 release scheduled for Thursday, April 9. The $18.2 billion increase in net liquidity typically correlates with expanded financial system capacity, as rising liquidity has historically coincided with periods when risk assets experience upward price pressure due to increased available capital in the banking system.
March's labor market data showed a sharp reversal from February's tariff-shock weakness, with non-farm payrolls adding 178K jobs versus the 60K estimate—a 118K beat that more than erased the prior month's revised -133K print, while the unemployment rate ticked down to 4.3% from 4.4%. The miss on wage growth, however, presents a conflicting signal: average hourly earnings rose just 0.2% month-over-month against the 0.3% estimate and slowed to 3.5% year-over-year from 3.8%, suggesting labor market tightness may be easing even as headline job creation rebounded. Today's ISM Services PMI (estimated at 55.0 versus 56.1 prior) and tomorrow's durable goods orders will test whether the services sector—which represents roughly 70% of GDP—is holding up amid manufacturing pressures, with particular focus on the ISM's employment and prices paid components for clues on whether March's jobs rebound has legs and whether inflation pressures are truly moderating.
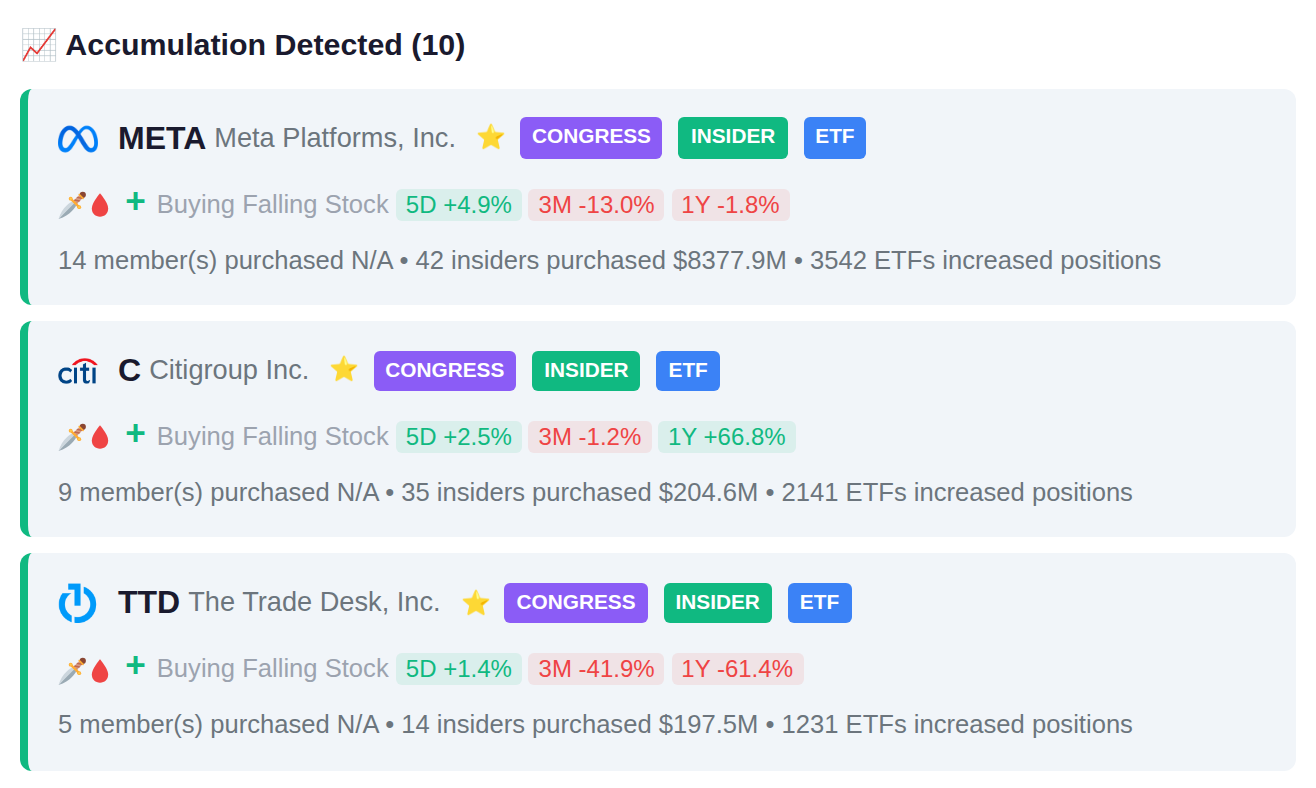
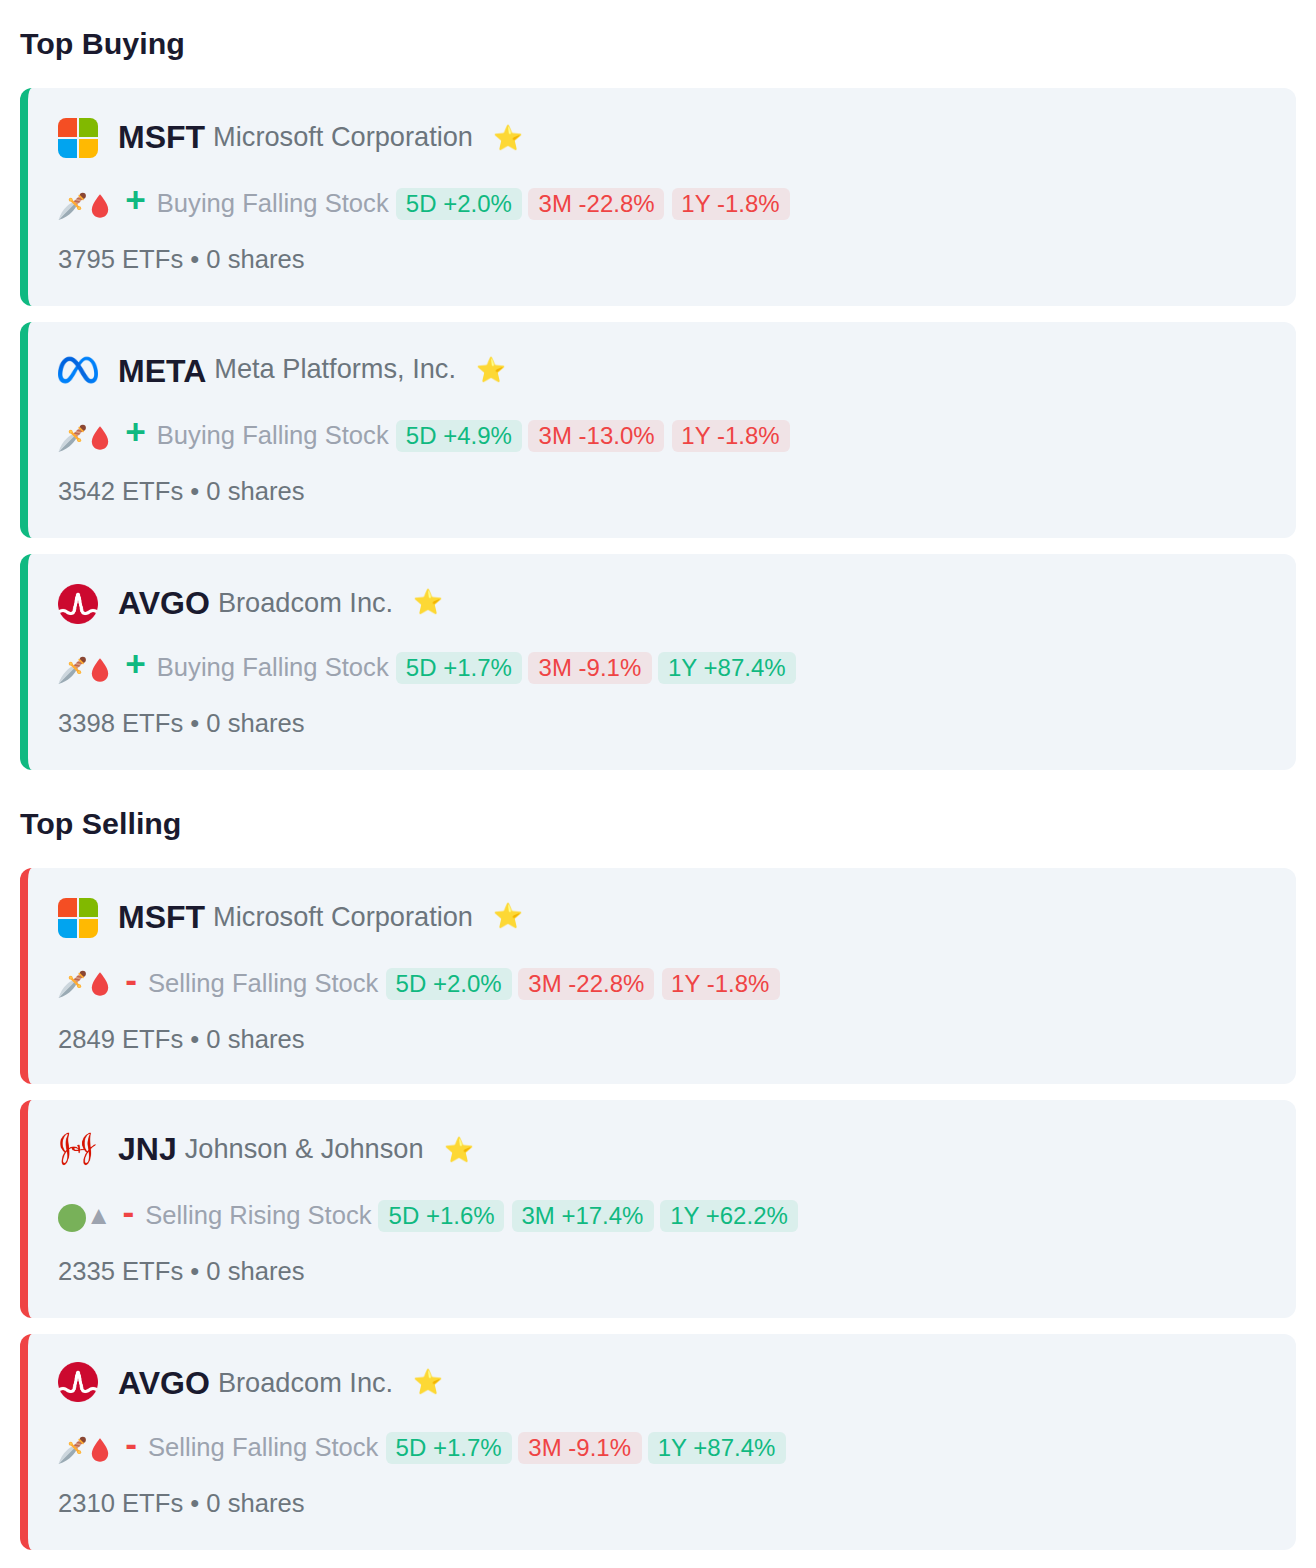
Institutional flow data shows a mixed technology positioning this quarter, with MSFT and AVGO appearing among both the most-added (3,795 and 3,398 ETFs respectively) and most-removed positions (2,849 and 2,310 ETFs), while META saw concentrated buying from 3,542 ETFs. The even 10-to-10 split between funds adding versus removing positions suggests sector-level indecision, with healthcare's JNJ appearing among the top redemptions as 2,335 ETFs reduced their stakes.
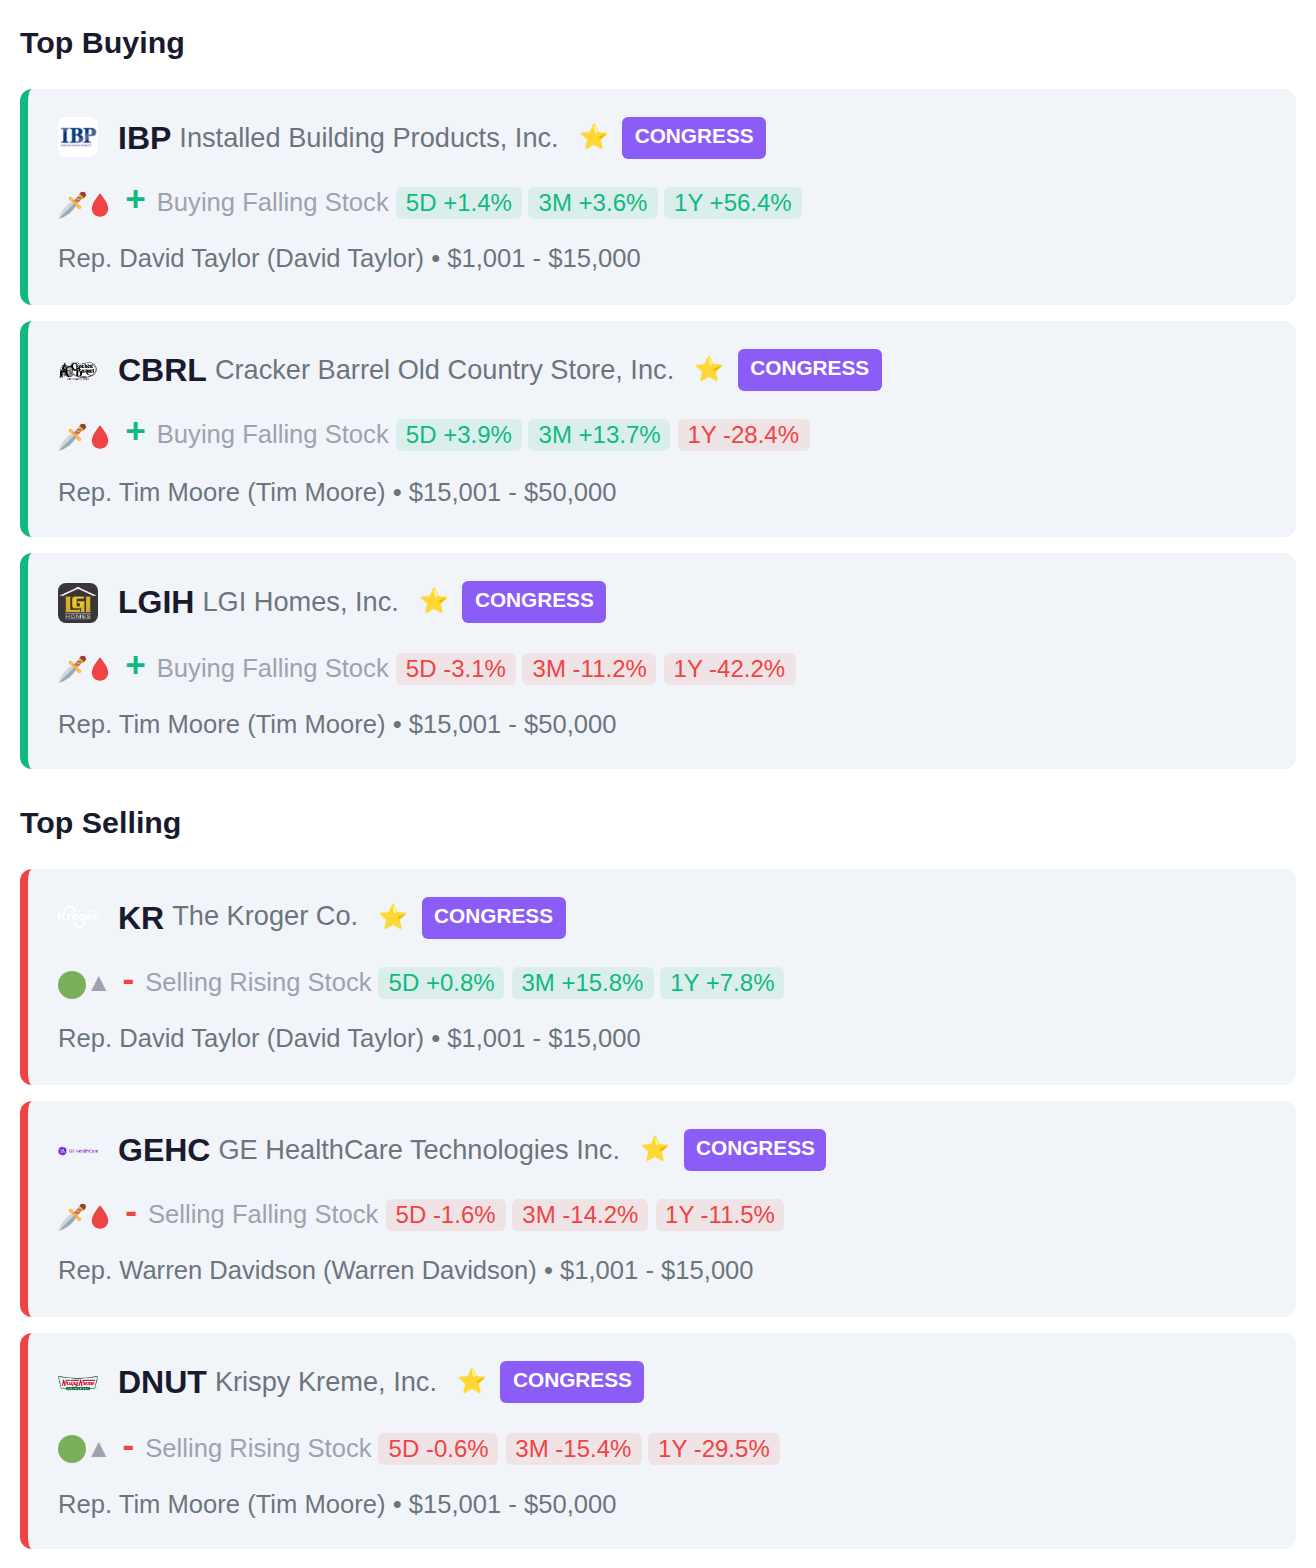
# Congressional Trading Activity Recent congressional filings show Rep. David Taylor rotated out of grocery retailer KR and into IBP, while Rep. Tim Moore made multiple moves by selling donut chain DNUT and purchasing casual dining stock CBRL along with homebuilder LGIH. Rep. Warren Davidson reduced his position in medical technology company GEHC during this period. The transactions reveal activity concentrated in consumer-facing sectors, with two representatives making changes to their restaurant industry holdings.
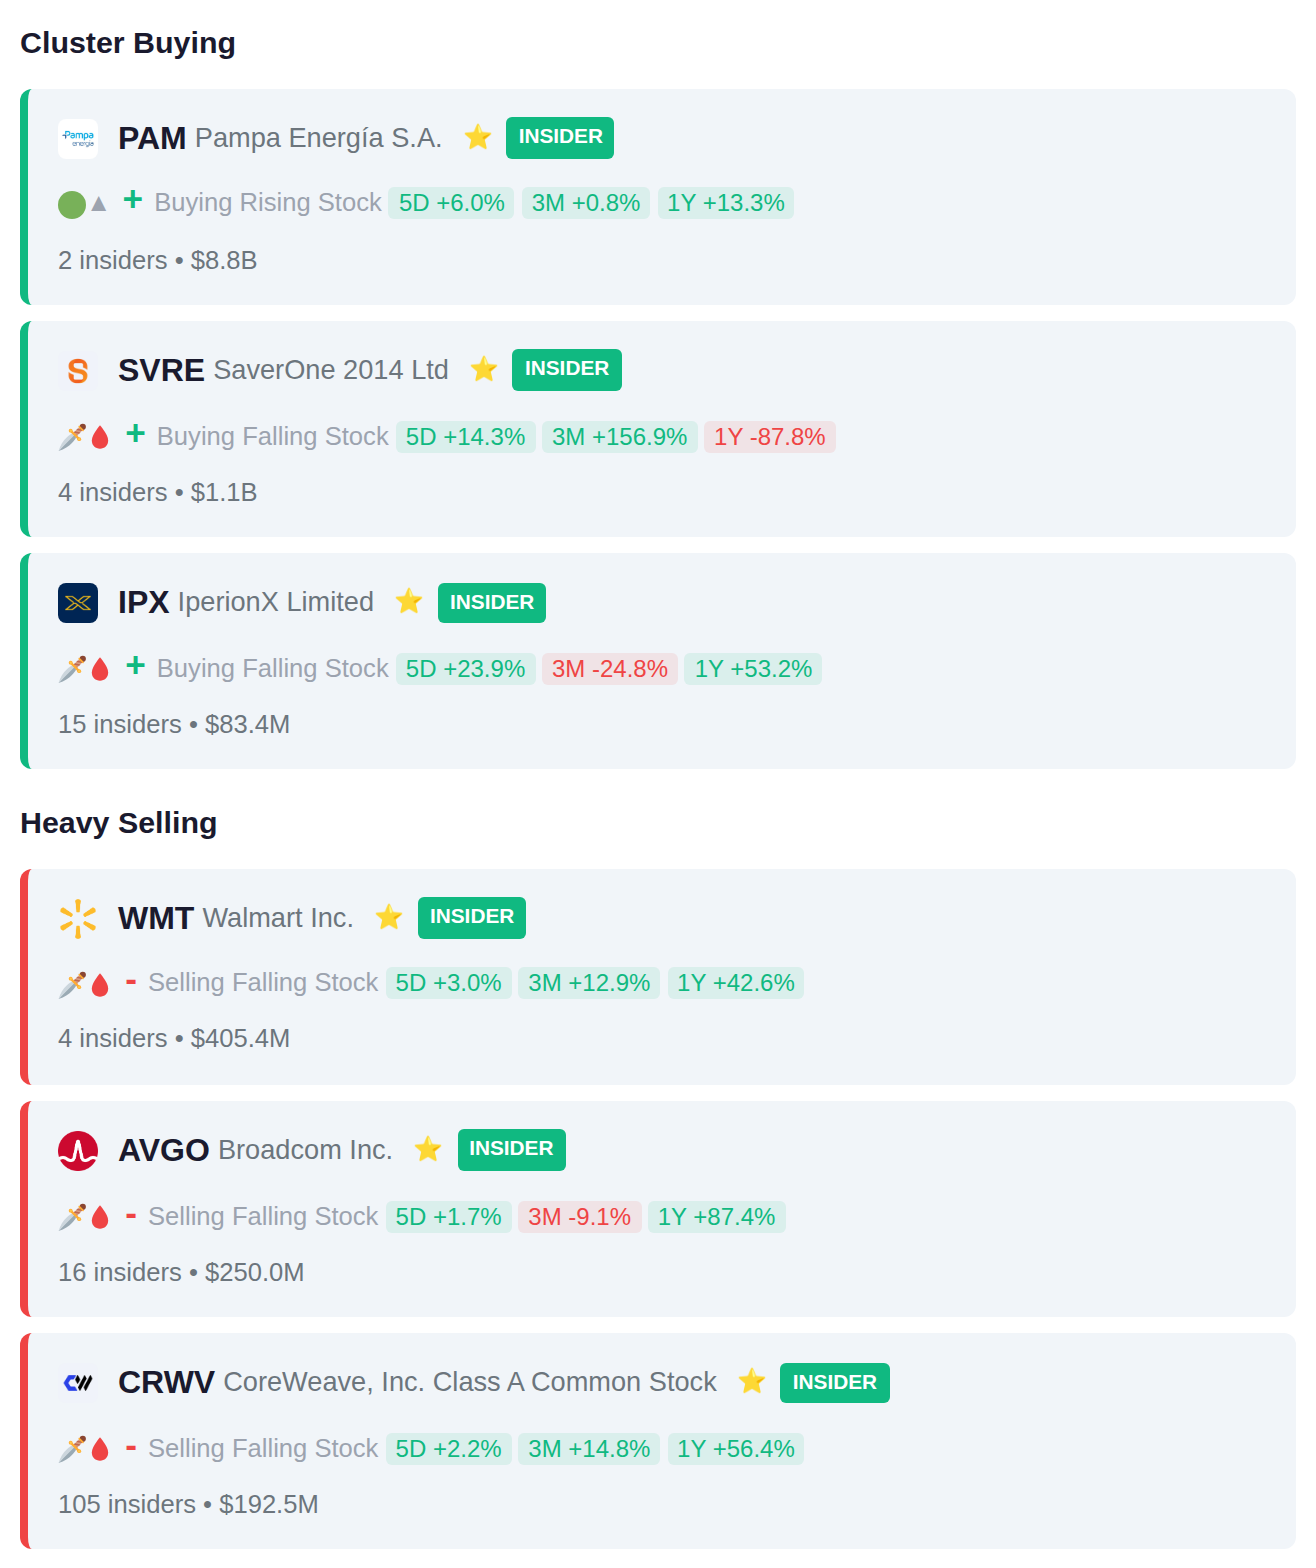
Insider activity showed balanced signals with 15 accumulation versus 15 distribution events this period. Notable cluster selling occurred at WMT where 4 insiders disposed of $405.4M in shares, AVGO with 16 insiders offloading $250M, and CRWV where 105 insiders collectively sold $192.5M, while IPX saw coordinated purchasing from 15 insiders.
Thirty-three companies report earnings today, with MDKA.JK and 7630.T showing recent accumulation patterns ahead of their results, while SCMA.JK and 3148.T have experienced distribution activity. Yesterday's session saw AXIA gain 6.3% among notable movers. No companies are scheduled to report tomorrow.