The Edge
Know What They Know
🐷 PIG ROAST
💬 Word on the Street
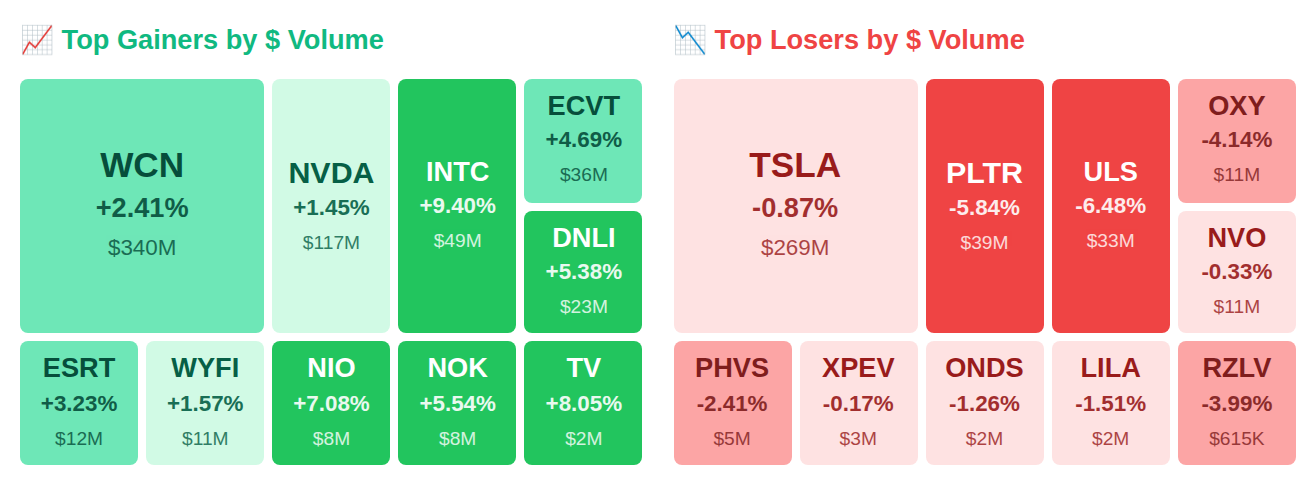
While Rep. April Delaney quietly scooped up shares of Rollins Inc (ROL) and the Fed pumped $18.2 billion into the system, Intel (INTC) hijacked Elon Musk's Terafab AI project and rocketed 11% after-hours—even as insiders at Crown Castle Inc (CCI) dumped a staggering $266.6 million in what might be the biggest one-day exit we've tracked this quarter. The VIX just collapsed 15.8% to 25.8, but smart money recorded a $208.6 million net outflow today, suggesting the sharks are circling different waters than the headlines suggest. Here's what smart money is doing today.
📚 Jargon Buster
Case-Shiller
Fancy house price index. Lags reality by three months but CNBC treats it like gospel.
The VIX currently sits at 25.78, indicating elevated fear in equity markets, though it declined 15.8% over the past week as some anxiety appears to be receding from recent highs. Meanwhile, the MOVE index at 11.05 reflects relatively subdued expectations for bond market volatility despite rising 8.6% week-over-week, presenting a divergent picture where equity traders remain cautious while fixed income markets show comparative calm. This split suggests investors are pricing in continued stock market uncertainty while maintaining confidence in the stability of the Treasury market.

|| Market Sutra ||
"You don't rise to your best trade; you fall to your worst habit."
— Overleveraging killed more traders in 2021–2022 than bad ideas
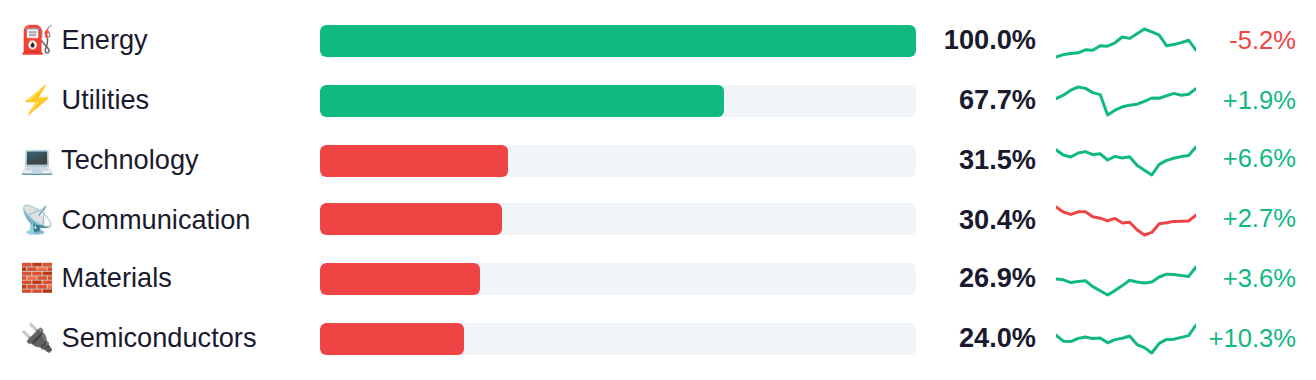
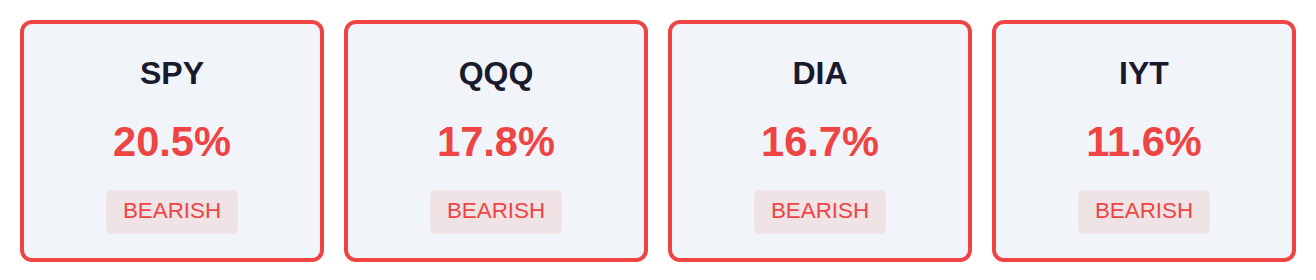
Market breadth remains notably weak across major indices, with only 20% of SPY components advancing and similar narrow participation in QQQ and DIA. Energy and Utilities are capturing the majority of institutional flows while traditional growth areas like Technology show only modest relative strength at 32%, creating a defensive rotation pattern as Real Estate, Industrials, and Financials attract minimal buying interest. This divergence between narrow leadership in defensive sectors and broad-based weakness across cyclical areas reflects a risk-off positioning among professional investors.
The Fed's net liquidity stood at $6.68 trillion as of April 01, up $18.2 billion from the prior week, indicating an expansion in available market liquidity that historically correlates with supportive conditions for risk assets. The next H.4.1 report releases Thursday, April 09, which will show whether this liquidity expansion continues or reverses.
Yesterday's energy data painted a mixed picture as crude oil inventories surged by 3.081M barrels against expectations of just 0.7M—a build more than four times consensus—while gasoline stocks drew down 1.589M versus the 1.4M estimate, signaling continued demand even as mortgage rates held near 6.5% for the second consecutive week. Today's focus centers on the Core PCE Price Index, the Fed's preferred inflation gauge, with the year-over-year reading expected to tick down to 3.0% from 3.1%, while the final Q4 GDP revision is forecast to show a sharp deceleration to 0.7% from the prior 4.4% estimate—a dramatic cooling that would mark the slowest quarterly growth since Q1 2023. Tomorrow brings the critical March CPI report where headline inflation is projected to jump to 3.4% year-over-year from 2.4%, driven by an unusually large 1.0% monthly gain versus February's 0.3%, which would represent the sharpest single-month increase since mid-2022 and potentially reignite concerns about the Fed's rate path.
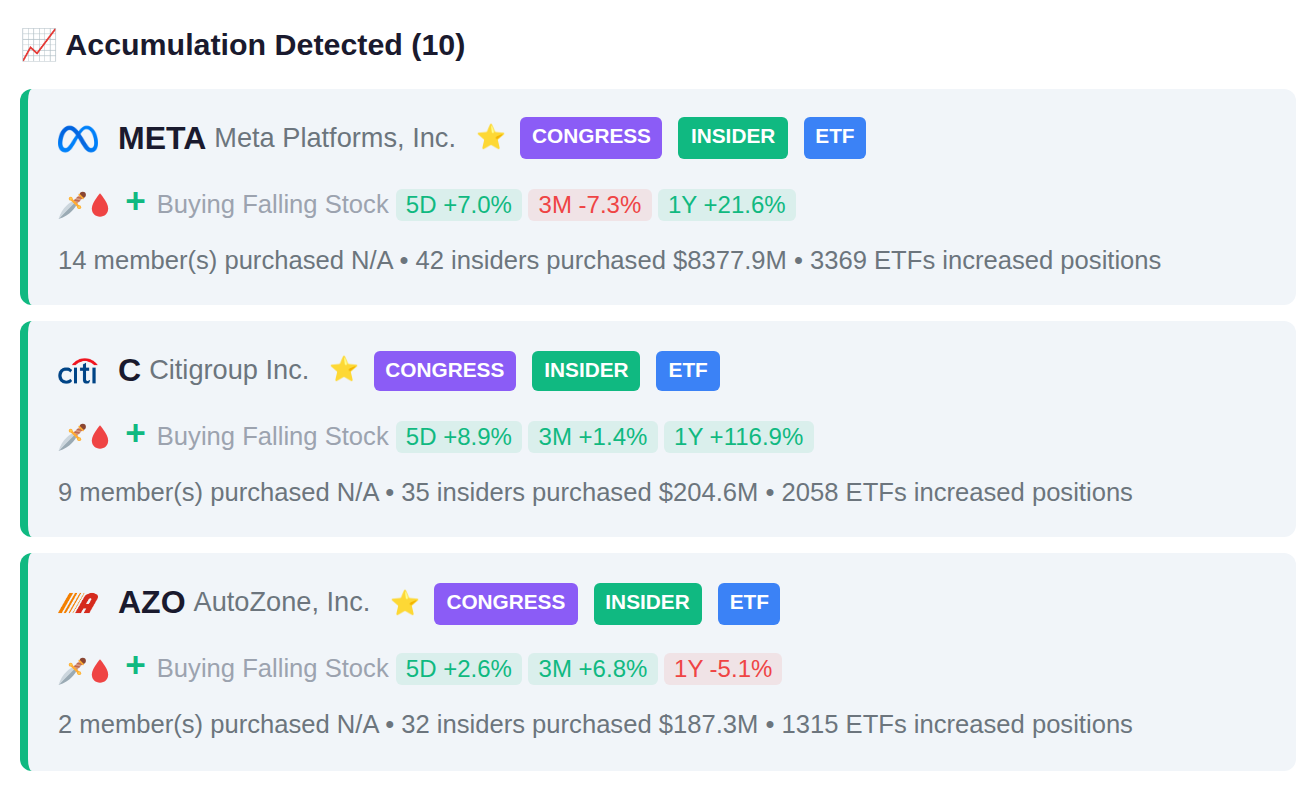
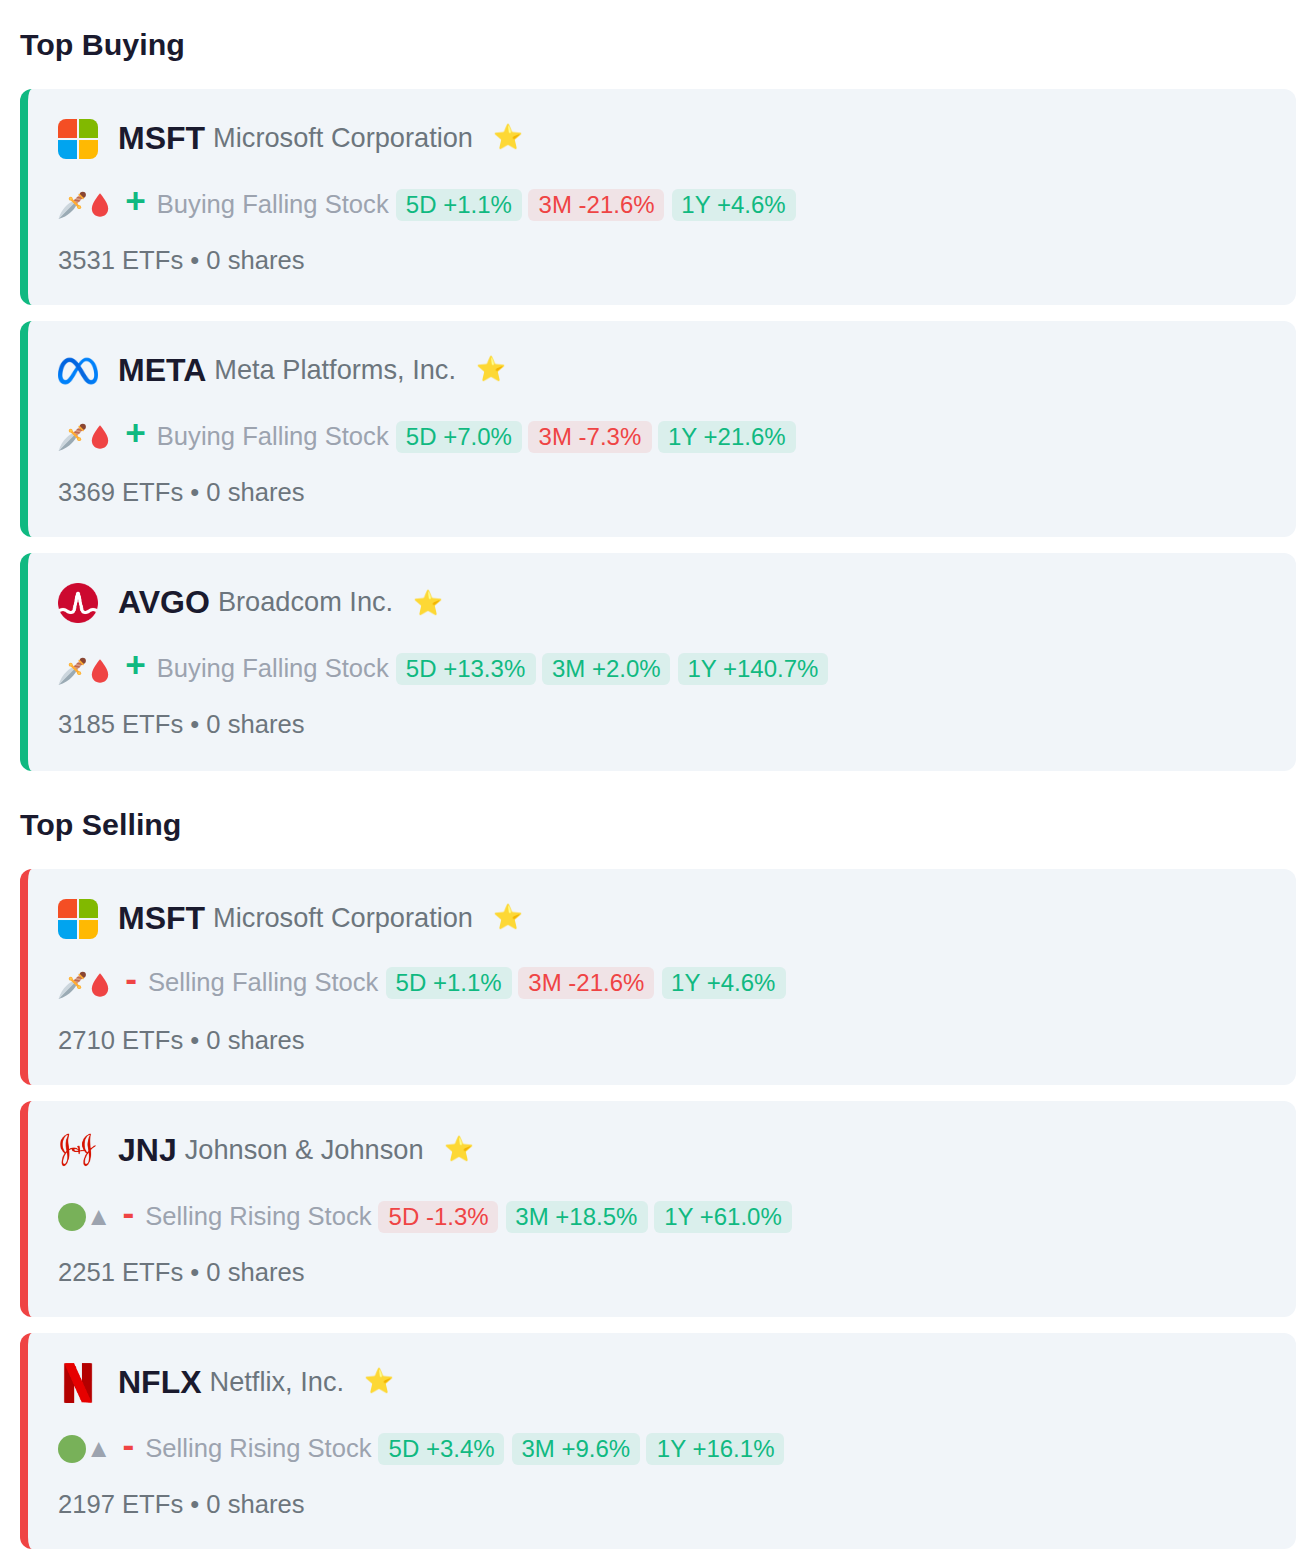
Institutional flows show a technology sector concentration, with ETFs adding positions in mega-cap tech names MSFT, META, and AVGO, while simultaneously trimming exposure to consumer healthcare (JNJ) and streaming entertainment (NFLX). The data reveals balanced overall activity with 10 ETFs adding and 10 removing positions, suggesting selective rotation within portfolios rather than broad directional positioning.
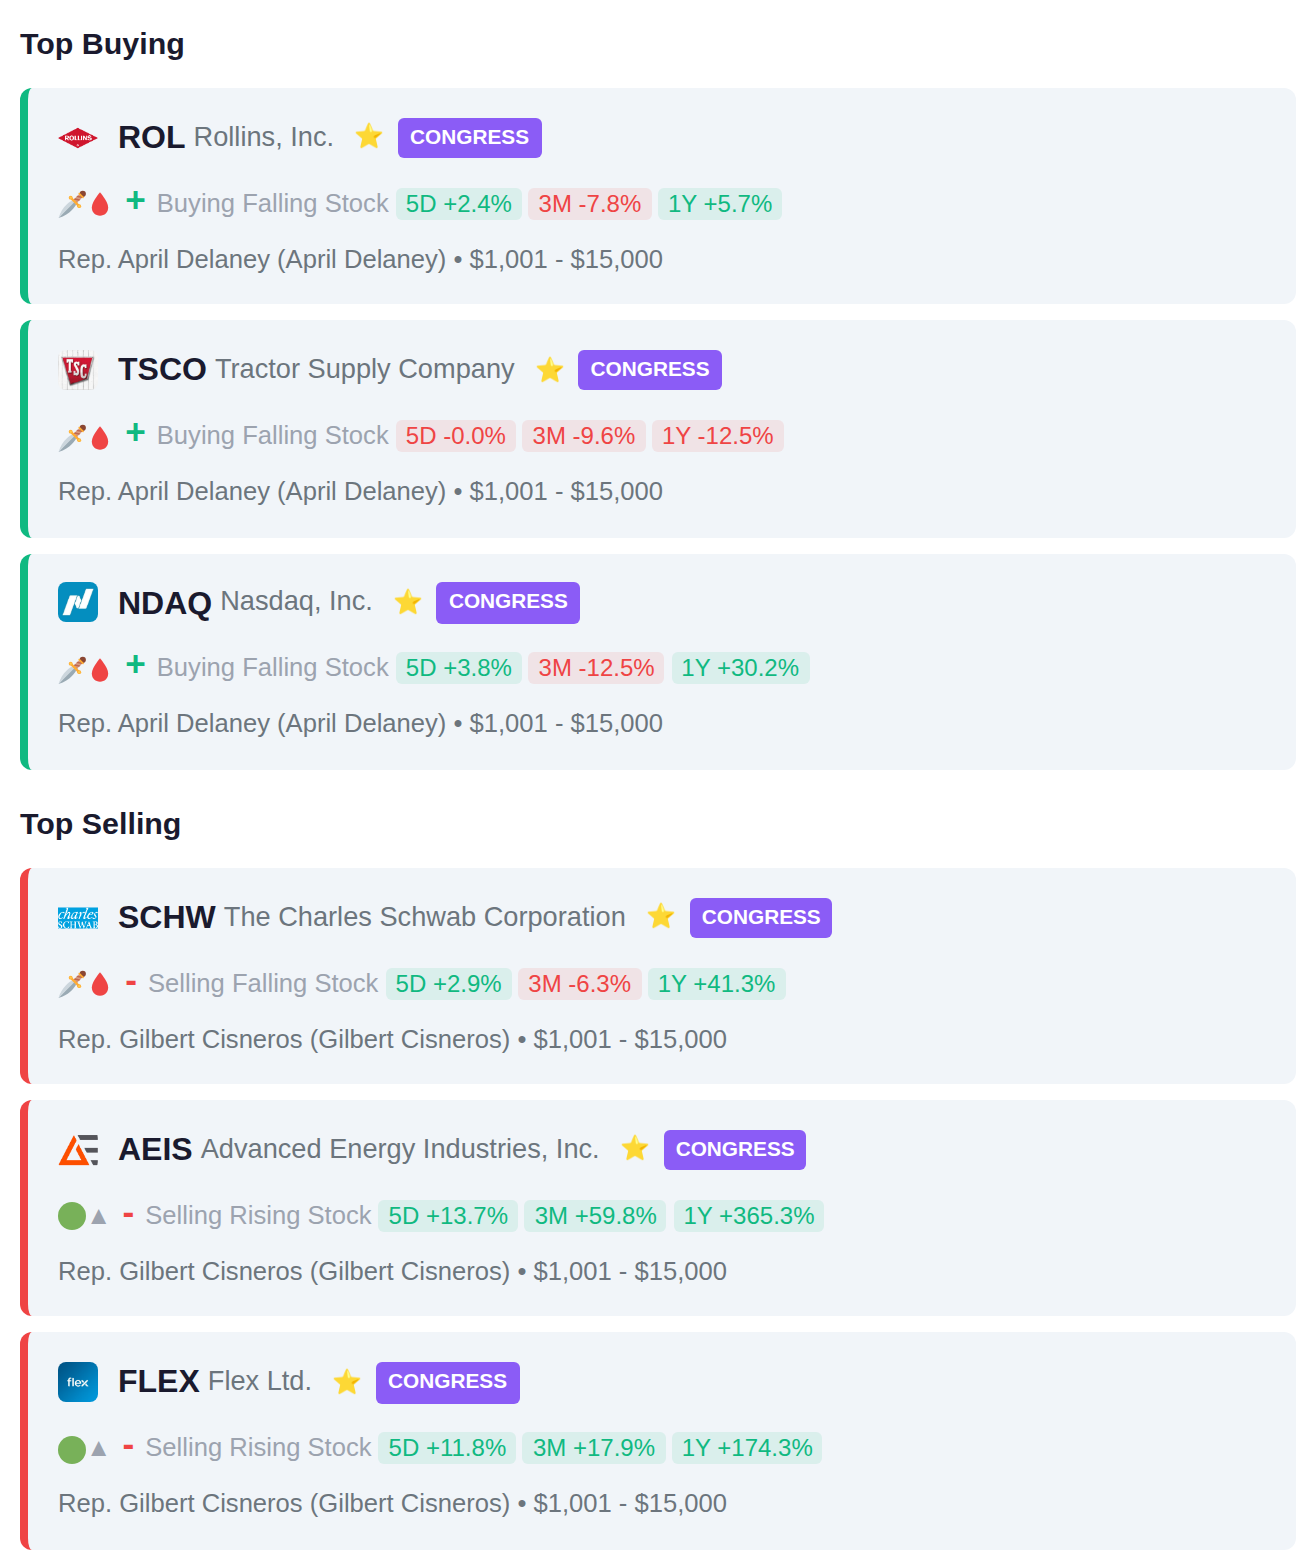
Rep. April Delaney purchased shares in three companies: Rollins Inc (ROL), Tractor Supply Company (TSCO), and Nasdaq Inc (NDAQ). Rep. Gilbert Cisneros sold positions in Charles Schwab (SCHW), Advanced Energy Industries (AEIS), and Flex Ltd (FLEX), representing a pattern of one member adding new positions while another reduced holdings across their portfolio.
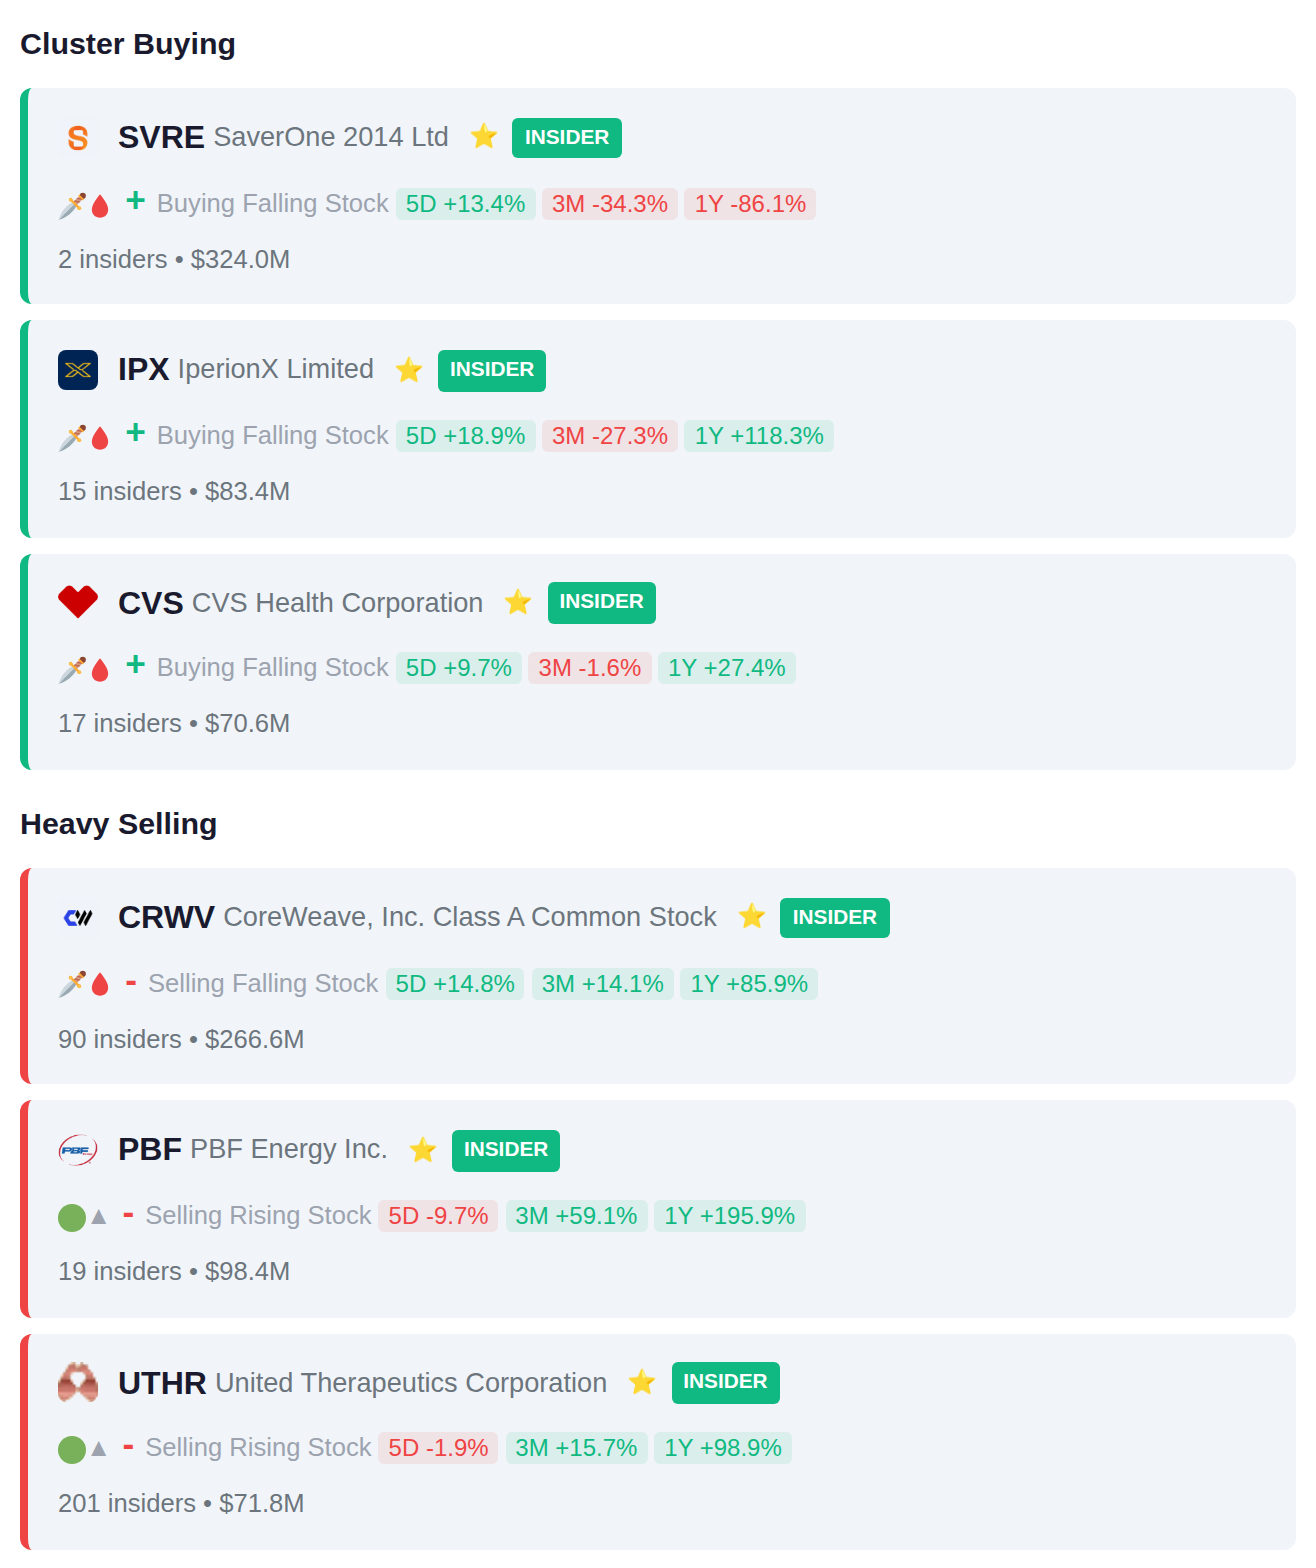
Recent insider filings show significant cluster activity with 17 insiders purchasing shares of CVS, while on the selling side, 201 insiders at UTHR collectively disposed of $71.8 million in stock and 90 insiders at CRWV sold a combined $266.6 million. The week's activity resulted in an even split with 15 accumulation signals balanced against 15 distribution signals across all tracked companies.
Ninety-nine companies report earnings today, with notable accumulation signals appearing in 9861.T and 7513.T ahead of their results. Meanwhile, TCS.BO and TCS.NS show distribution patterns as they prepare to report, following yesterday's session where APLD gained 17.1% and 0QZ4.L advanced 9.9%.