The Edge
Know What They Know
🐷 PIG ROAST
💬 Word on the Street
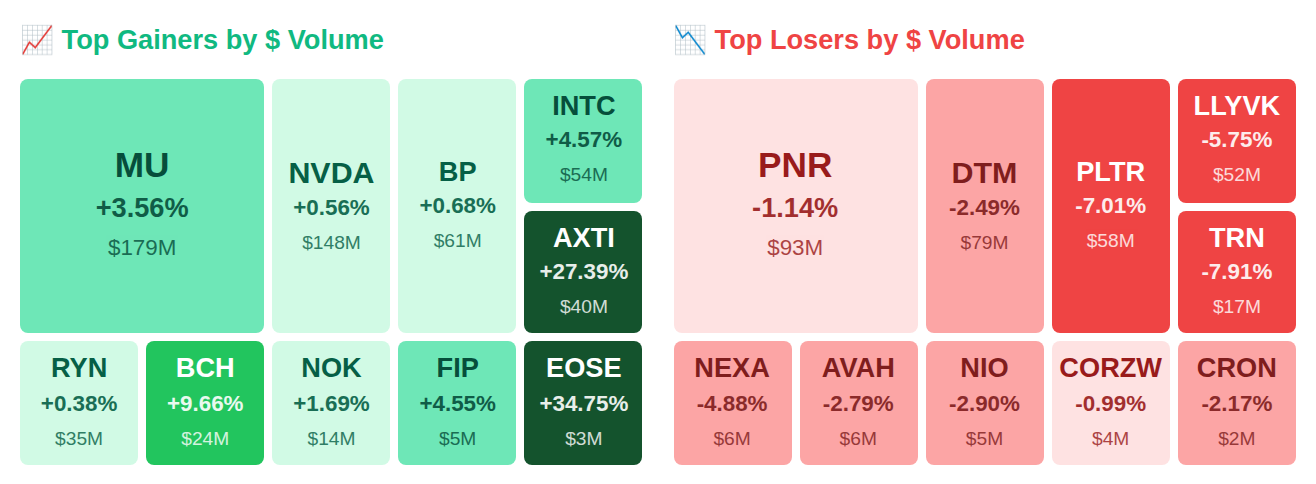
While Rep. April Delaney quietly purchased shares of Semiconductor Global Industries (SGI) and the Fed pumped $18.5 billion into the system, insiders at Live Nation Entertainment (LGN) were sprinting for the exits with $1.7 billion in sales—part of a massive $1.8 billion net outflow from those supposedly in the know. Meanwhile, Nebius Group caught acquisition fever and rocketed 9% after hours (548% in a year, naturally), even as smart money collectively moved $2.5 billion toward the door against just $733 million in fresh bets. Here's what smart money is doing today.
📚 Jargon Buster
When Lambo
The official battle cry of every 0.1 BTC holder who’s 100% getting that purple Lambo next cycle, ser. (Narrator: he bought a Honda Civic.)
Equity market volatility declined substantially this week, with the VIX falling 16.7% to 21.04, though it remains in elevated territory above the 20 level that typically signals heightened investor caution. Meanwhile, bond market volatility moved in the opposite direction, as the MOVE index surged 32.5% to 11.51, creating an unusual divergence where fixed income traders are pricing in increased uncertainty while equity volatility subsides. This split between falling stock market fear and rising bond market stress suggests investors are navigating conflicting signals across asset classes.

|| Market Sutra ||
"A smart trader adapts; a great trader anticipates."
— Druckenmiller rotated to tech early in the 1990s before the boom
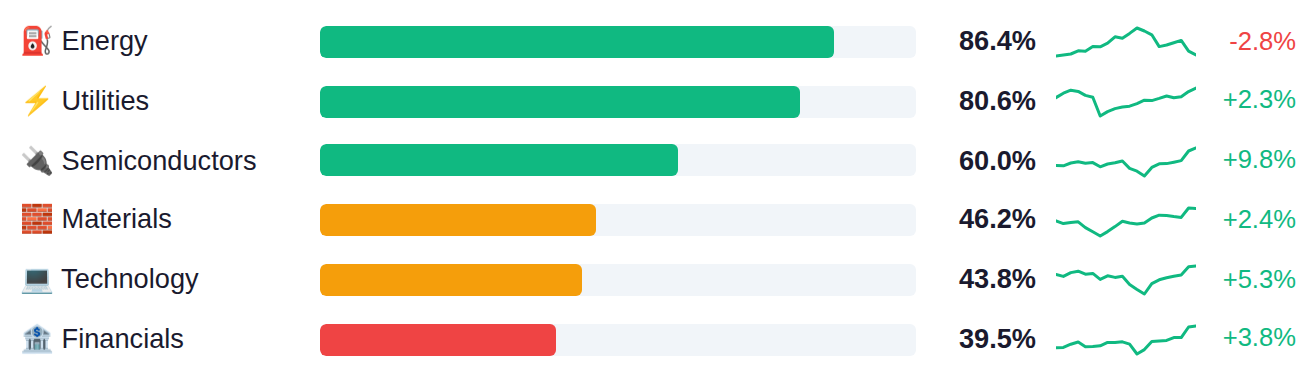
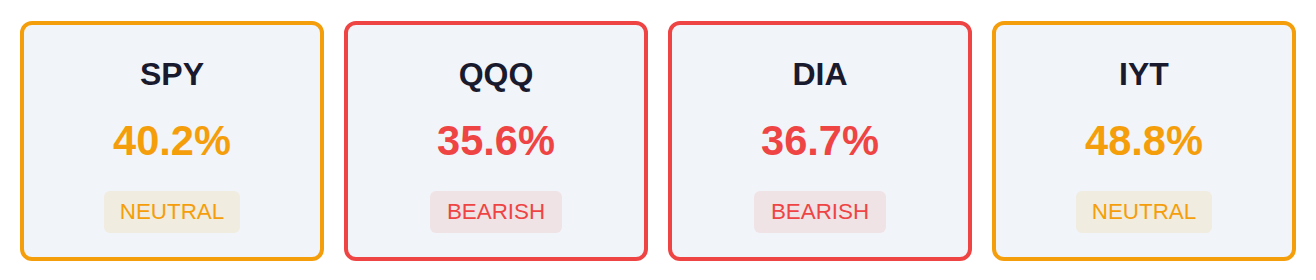
The market is showing a narrow leadership pattern with Energy and Utilities demonstrating significant strength at 86% and 81% respectively, while traditionally growth-oriented sectors like Healthcare and Consumer Discretionary lag considerably in the 23-25% range. Index breadth readings across major benchmarks remain weak, with SPY at 40% and QQQ at 36%, creating a notable divergence between the outperformance in defensive and commodity-linked sectors and the broader market's tepid participation. This concentration in Energy, Utilities, and Semiconductors amid subdued overall breadth suggests money is rotating into specific pockets rather than lifting the broader market.
As of April 8, Fed net liquidity stands at $6.69 trillion, up $18.5 billion week-over-week, with the next H.4.1 release scheduled for Thursday, April 16. This increase in liquidity typically creates more favorable conditions for risk assets, as additional dollars in the financial system tend to flow into equities and other markets when participants seek returns.
Yesterday's data painted a picture of economic deceleration, with Q4 GDP revised down to just 0.5% annualized growth versus the 0.7% estimate (and sharply below the prior quarter's 4.4%), while personal income unexpectedly contracted 0.1% in February against expectations for 0.3% growth—though corporate profits surged 5.7% versus the 3.9% estimate, suggesting margin expansion even as the economy softens. The labor market showed mixed signals with initial jobless claims at 219K missing the 210K forecast, yet continuing claims beat at 1.794M versus 1.84M expected, while inflation readings came in exactly as anticipated with core PCE holding at 0.4% monthly and 3.0% annually. Today's March CPI data carries outsized importance for rate cut expectations, with estimates calling for a significant acceleration to 3.4% year-over-year from 2.4% and a sharp 1.0% monthly increase versus February's 0.3%—potentially the hottest monthly reading since mid-2022—while Michigan consumer sentiment is expected to deteriorate further to 52.0 from 53.3, which would mark near-historic lows in confidence.
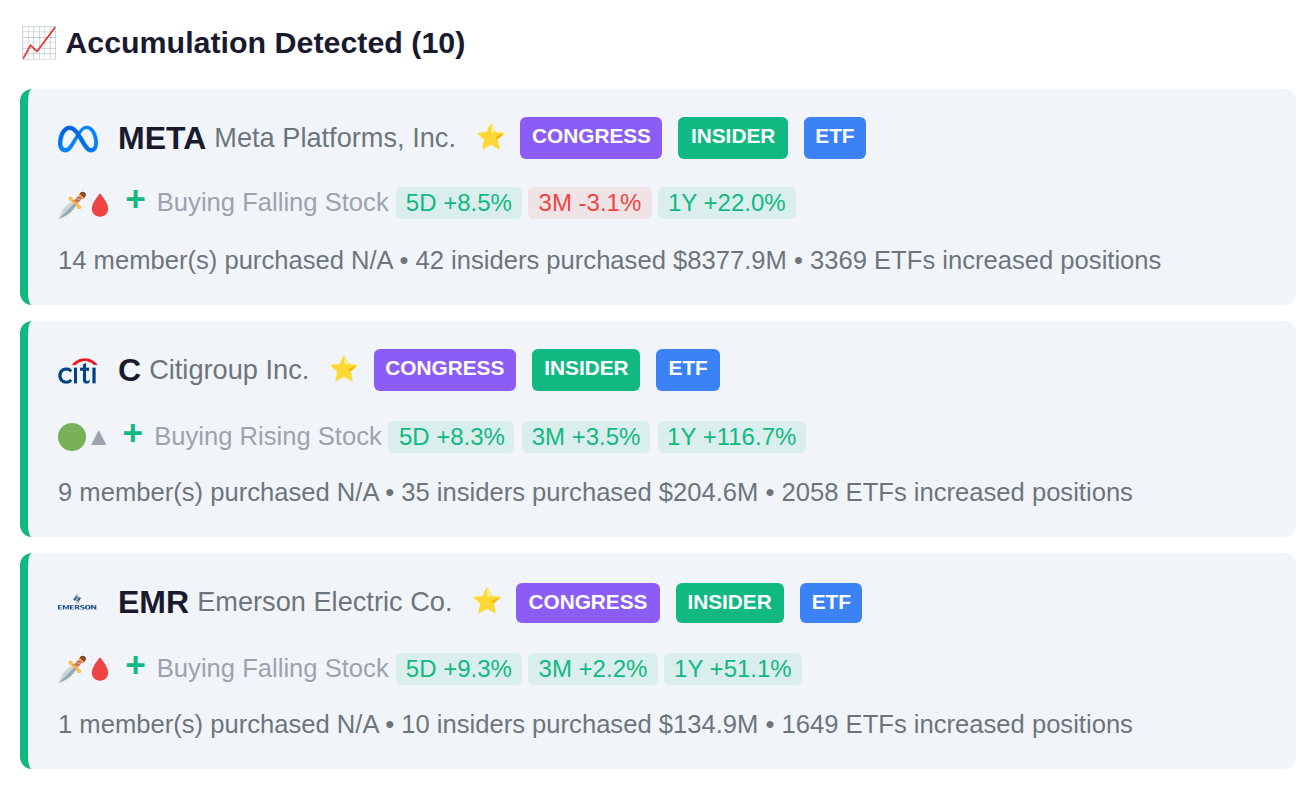
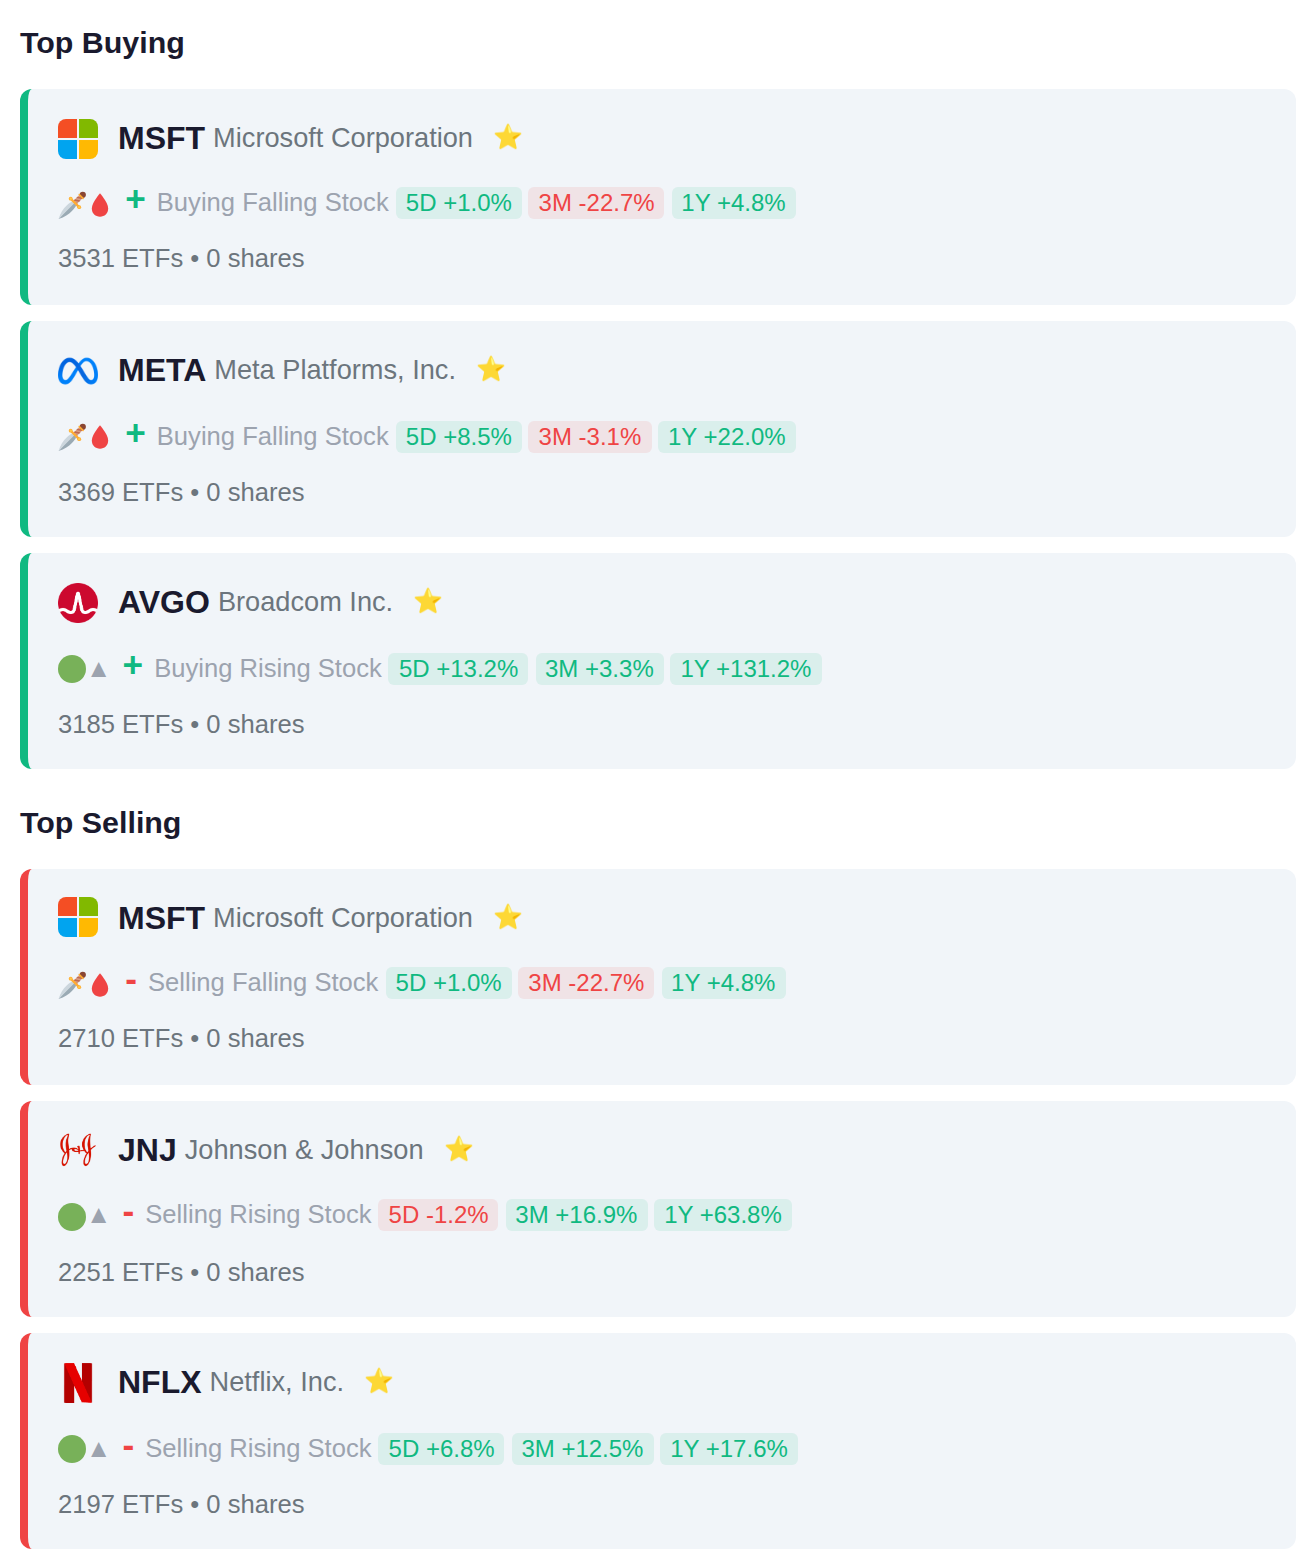
Institutional flow data shows ETFs rotating into technology names, with MSFT, META, and AVGO seeing the highest number of funds adding positions despite MSFT also appearing among top reductions. The mixed activity on Microsoft and notable selling in healthcare stalwart JNJ and streaming giant NFLX suggests institutions are selectively trimming mature positions while concentrating exposure in AI-leveraged technology plays.
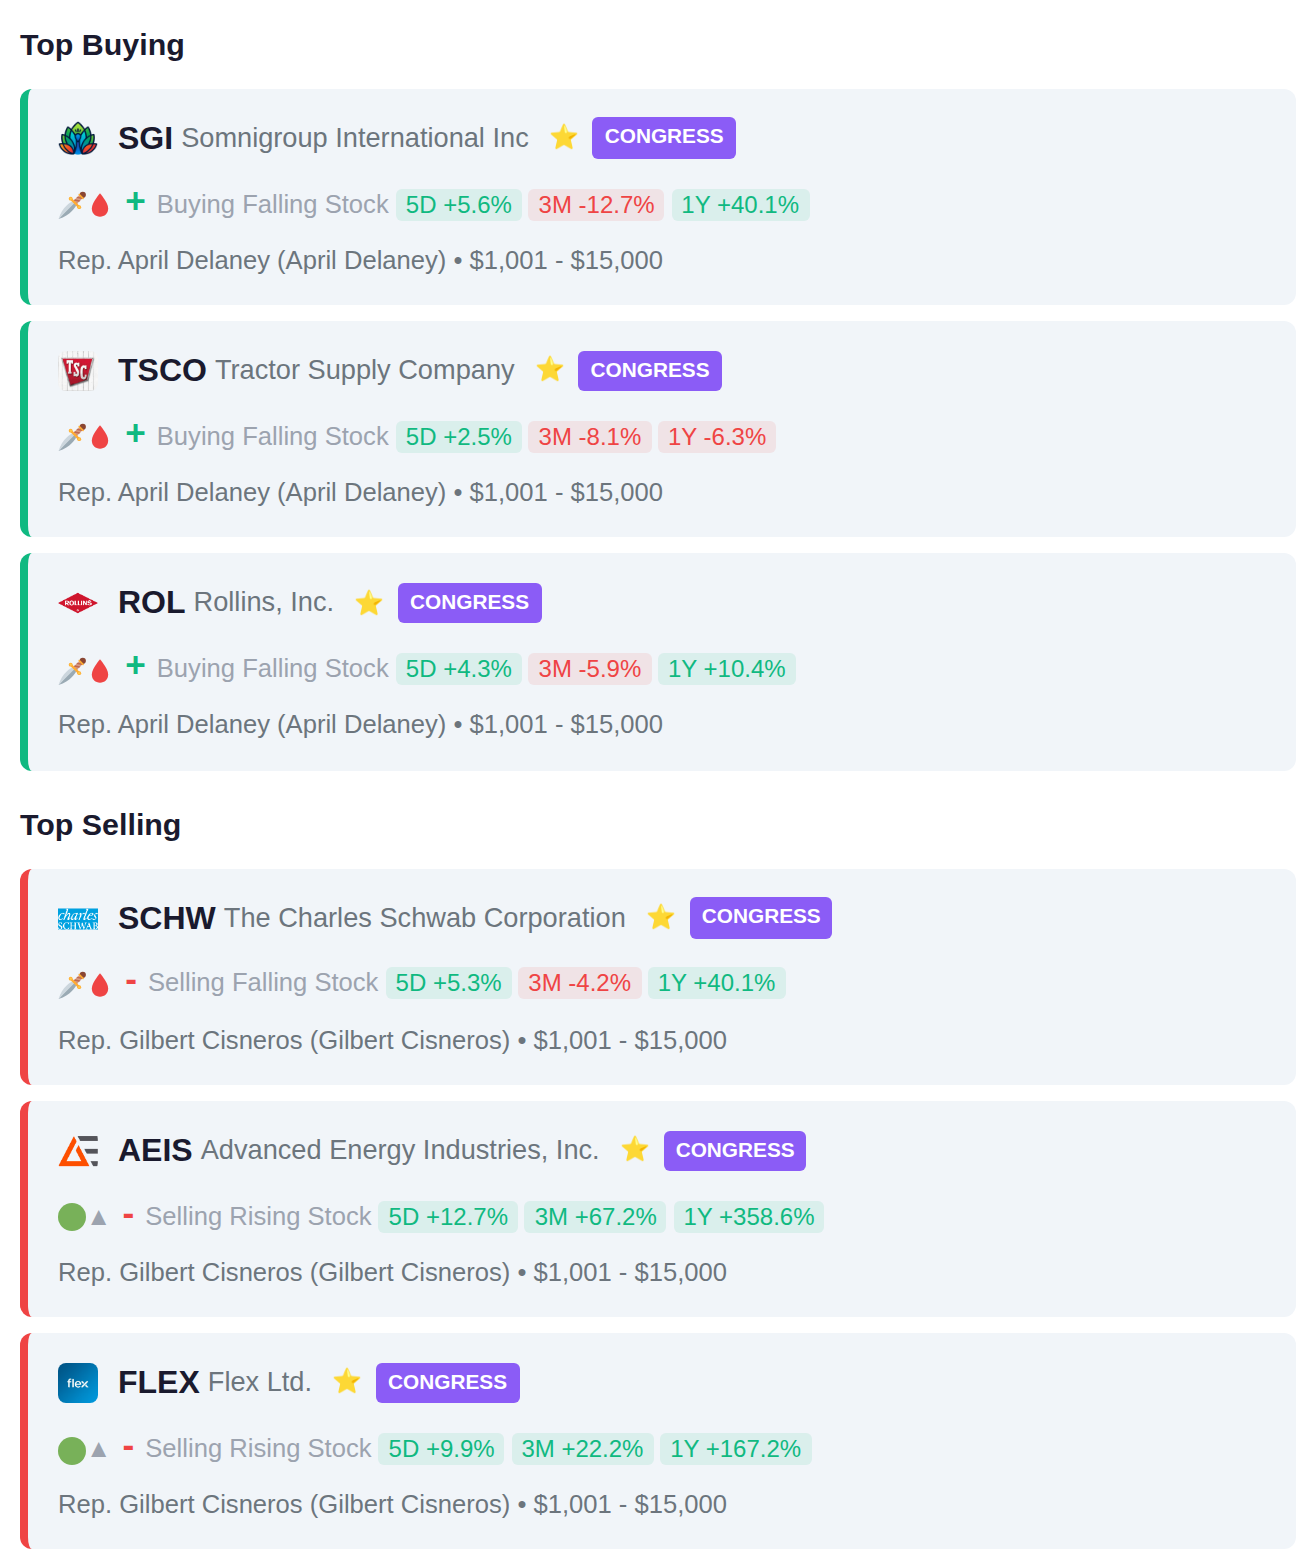
Rep. April Delaney recently purchased shares in three companies: SGI, TSCO (Tractor Supply Company), and ROL (Rollins Inc.), spanning technology services, rural retail, and pest control sectors. Rep. Gilbert Cisneros sold positions in SCHW (Charles Schwab), AEIS (Advanced Energy Industries), and FLEX (Flex Ltd.), reducing exposure across financial services and technology manufacturing.
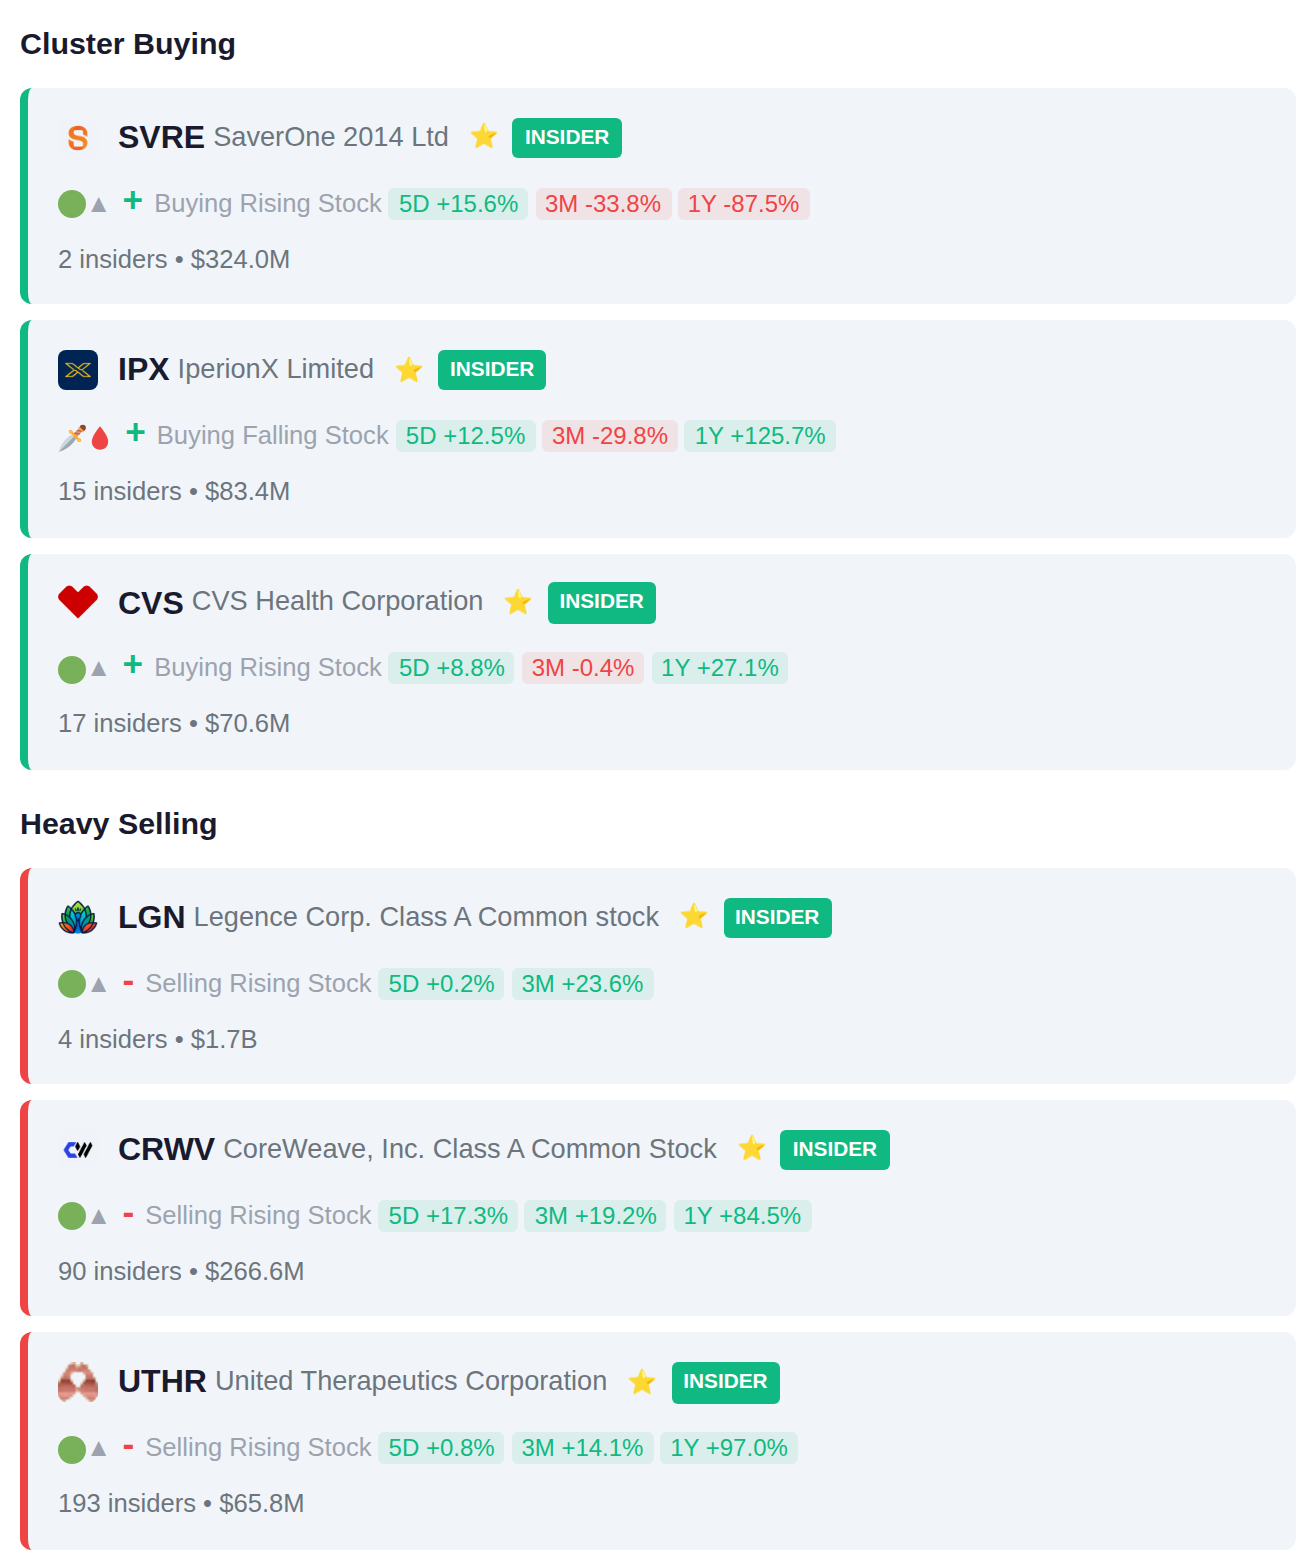
Recent insider filings show concentrated accumulation at CVS with 17 insiders purchasing shares and at IPX with 15 insiders adding positions. On the selling side, UTHR recorded 193 insiders reducing positions totaling $65.8M, while LGN saw 4 insiders sell $1.7B in shares and CRWV had 90 insiders distribute $266.6M.
139 companies report earnings today, with accumulation signals noted in ANANDRATHI.BO and 1419.T ahead of their results, while institutional positioning shows distribution in 6506.T and 2899.HK. Yesterday's session saw significant moves in 6323.T which jumped 24.9%, 0R0P.L up 24.8%, and FRCOF gaining 22.5%. No earnings are scheduled for tomorrow's session.