
SCCR
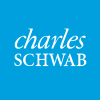
Schwab Core Bond ETF
1W: -0.3%
1M: -1.0%
3M: -2.4%
YTD: -0.9%
1Y: +4.1%
$25.41
+0.01 (+0.04%)
Weekly Expected Move ±0.6%
$25
$25
$25
$25
$26
Overview
Chart
Holdings
Changes
Technicals
Analysis
Peers
Institutions
Dark Pool
Short Interest
Dividends
Weather
Key Statistics
AUM$1.4B
Holdings59
Top 10 Wt13.1%
Volume276,071
Avg Volume312,363
Beta0.04
Portfolio Fundamentals
P/E21.6
P/B3.5
Div Yield1.56%
ROE16.8%
% Profitable33%
Inception2025-02-05
Sector Allocation
Other
64.1%
Financial Services
13.2%
Industrials
6.9%
Technology
3.4%
Healthcare
3.1%
Real Estate
2.4%
+6 more
Top 10 Holdings
| # | Name | Ticker | Weight % | Market Value | Shares |
|---|---|---|---|---|---|
| 1 | TREASURY NOTE | — | 12.90% | $182.8M | 184,300,000 |
| 2 | FHLMC 30YR UMBS SUPER | — | 8.21% | $116.3M | 124,828,076 |
| 3 | FNMA 30YR UMBS SUPER | — | 6.90% | $97.8M | 110,675,765 |
| 4 | GNMA2 30YR | — | 6.47% | $91.6M | 98,034,124 |
| 5 | FNMA 30YR UMBS | — | 5.94% | $84.2M | 90,147,747 |
| 6 | TREASURY BOND | — | 4.37% | $61.9M | 72,900,000 |
| 7 | NEW YORK N Y | NYC | 1.86% | $26.3M | 26,435,000 |
| 8 | BANK OF AMERICA CORP | BAC | 1.31% | $18.6M | 18,395,000 |
| 9 | ILLINOIS ST | ILS | 1.28% | $18.2M | 18,230,000 |
| 10 | CITIGROUP INC | C | 1.25% | $17.7M | 18,185,000 |