
GVUS
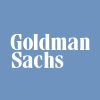
Goldman Sachs MarketBeta Russell 1000 Value Equity ETF
1W: -0.0%
1M: -5.2%
3M: +0.7%
YTD: +0.8%
1Y: +15.6%
$55.34
+0.15 (+0.27%)
After Hours: $57.67 (+2.33, +4.21%)
Weekly Expected Move ±1.8%
$52
$53
$54
$55
$56
Overview
Chart
Holdings
Changes
Technicals
Analysis
Peers
Institutions
Dark Pool
Short Interest
Weather
ETF-Level Metrics
AUM$419M
Holdings857
Top 10 Wt19.1%
Beta0.78
% Profitable85%
Coverage99%
Portfolio Valuation
P/E23.1
P/B4.0
P/S3.5
EV/EBITDA15.3
P/FCF30.8
PEG1.67
Profitability & Returns
Gross Margin42.5%
Net Margin14.9%
ROE18.2%
ROA4.5%
ROIC16.4%
Div Yield1.88%
Leverage & Liquidity
Debt/Equity0.70
Debt/Assets0.17
Net Debt/EBITDA-0.3x
Interest Cov3.3x
Current Ratio1.09
Quick Ratio1.03
Growth (YoY)
Revenue+7.8%
Net Income+20.0%
EPS+20.9%
FCF+30.3%
EBITDA+16.8%
Rev CAGR 3Y+7.1%
Quality Scores
Piotroski F6.4
Altman Z3.96
IS Quality69.6
IS Overall54.7
IS Value53.1
Median P/E20.1
Sector Breakdown
12 sectors| Sector | # Holdings | Total Weight % | Avg P/E |
|---|---|---|---|
| Financial Services | 132 | 19.6% | 7.6 |
| Industrials | 147 | 13.5% | 29.7 |
| Technology | 114 | 12.4% | 127.4 |
| Healthcare | 84 | 11.7% | 4.0 |
| Communication Services | 42 | 8.0% | 31.7 |
| Energy | 36 | 7.4% | 21.7 |
| Consumer Defensive | 55 | 7.3% | 19.1 |
| Consumer Cyclical | 104 | 7.2% | 16.3 |
| Utilities | 37 | 4.6% | 19.2 |
| Real Estate | 62 | 4.0% | 68.0 |
| Basic Materials | 44 | 4.0% | 6.7 |
| Other | 3 | 0.3% | — |
Smart Money Overlap
77 holdings with signals| Symbol | Company | Weight % | Signals | Badge | Insider Buys | Congress | Since Signal |
|---|---|---|---|---|---|---|---|
| JPM | JPMorgan Chase & Co. | 2.63% | 4 | Bullish | 14 | 9 | +0.2% |
| JNJ | Johnson & Johnson | 1.92% | 4 | Bullish | 12 | 2 | +0.4% |
| WMT | Walmart Inc. | 1.60% | 4 | Bullish | 22 | 3 | +1.2% |
| CSCO | Cisco Systems, Inc. | 1.01% | 4 | Bullish | 5 | 6 | +0.1% |
| MRK | Merck & Co., Inc. | 0.98% | 4 | Bullish | 11 | 2 | +2.1% |
| RTX | RTX Corporation | 0.85% | 4 | Bullish | 18 | 3 | +0.2% |
| UNH | UnitedHealth Group Incorporated | 0.81% | 4 | Bullish | 7 | 5 | -1.7% |
| IBM | International Business Machines Corporation | 0.74% | 4 | Bullish | 10 | 8 | +2.5% |
| META | Meta Platforms, Inc. | 0.73% | 4 | Bullish | 42 | 14 | -3.2% |
| INTC | Intel Corporation | 0.69% | 4 | Bullish | 2 | 2 | +10.5% |
| T | AT&T Inc. | 0.64% | 4 | Bullish | 28 | 5 | -2.3% |
| DIS | The Walt Disney Company | 0.56% | 4 | Bullish | 29 | 3 | +0.3% |
| C | Citigroup Inc. | 0.54% | 4 | Bullish | 35 | 9 | -0.1% |
| PFE | Pfizer Inc. | 0.53% | 4 | Bullish | 11 | 2 | +6.6% |
| COP | ConocoPhillips | 0.52% | 4 | Bullish | 1 | 3 | +22.3% |
| CRM | Salesforce, Inc. | 0.49% | 4 | Bullish | 10 | 5 | -4.2% |
| HON | Honeywell International Inc. | 0.47% | 4 | Bullish | 11 | 3 | -4.2% |
| SCHW | The Charles Schwab Corporation | 0.46% | 4 | Bullish | 12 | 3 | +1.5% |
| WELL | Welltower Inc. | 0.45% | 4 | Bullish | 6 | 1 | -2.4% |
| DE | Deere & Company | 0.45% | 4 | Bullish | 10 | 3 | +22.9% |
Showing 50 of 860 holdings
· Page 1 of 18
| # | Name | Ticker | Weight % ▼ | Mkt Value | Shares | P/E | Mkt Cap | Sector |
|---|---|---|---|---|---|---|---|---|
| 1 | BERKSHIRE HATHAWAY INC. | BRK-B | 2.89% | $11.1M | 23,252 | 15.4 | $1.0T | Financial Services |
| 2 | JPMORGAN CHASE & CO | JPM | 2.63% | $10.1M | 34,254 | 14.4 | $794.5B | Financial Services |
| 3 | EXXON MOBIL CORPORATION | XOM | 2.22% | $8.6M | 53,265 | 24.1 | $669.5B | Energy |
| 4 | ALPHABET INC. | GOOGL | 2.01% | $7.7M | 25,955 | 27.0 | $3.6T | Communication Services |
| 5 | JOHNSON & JOHNSON | JNJ | 1.92% | $7.4M | 30,260 | 22.0 | $585.7B | Healthcare |
| 6 | AMAZON.COM INC | AMZN | 1.81% | $7.0M | 33,173 | 28.9 | $2.3T | Consumer Cyclical |
| 7 | ALPHABET INC. | GOOG | 1.62% | $6.2M | 21,127 | 27.0 | $3.6T | Communication Services |
| 8 | WALMART INC | WMT | 1.60% | $6.1M | 49,251 | 45.8 | $1.0T | Consumer Defensive |
| 9 | MICRON TECHNOLOGY, INC. | MU | 1.34% | $5.2M | 14,042 | 17.1 | $413.0B | Technology |
| 10 | CHEVRON CORPORATION | CVX | 1.21% | $4.6M | 23,555 | 32.2 | $397.7B | Energy |
| 11 | THE PROCTER & GAMBLE COMPANY | PG | 1.11% | $4.3M | 29,545 | 21.1 | $334.4B | Consumer Defensive |
| 12 | CISCO SYSTEMS, INC. | CSCO | 1.01% | $3.9M | 50,056 | 28.2 | $312.2B | Technology |
| 13 | MERCK & CO., INC. | MRK | 0.98% | $3.8M | 31,332 | 16.5 | $298.8B | Healthcare |
| 14 | BANK OF AMERICA CORP | BAC | 0.98% | $3.8M | 76,230 | 11.9 | $354.4B | Financial Services |
| 15 | CATERPILLAR INC (DELAWARE) | CAT | 0.97% | $3.7M | 5,114 | 37.7 | $335.6B | Industrials |
| 16 | RTX CORP | RTX | 0.85% | $3.3M | 16,825 | 39.2 | $263.4B | Industrials |
| 17 | WELLS FARGO & COMPANY | WFC | 0.82% | $3.1M | 39,043 | 12.0 | $248.7B | Financial Services |
| 18 | UNITEDHEALTH GROUP INCORPORATED | UNH | 0.81% | $3.1M | 11,447 | 20.9 | $251.7B | Healthcare |
| 19 | PHILIP MORRIS INTL INC | PM | 0.80% | $3.1M | 19,592 | 21.7 | $246.1B | Consumer Defensive |
| 20 | GOLDMAN SACHS GROUP, INC.(THE) | GS | 0.78% | $3.0M | 3,488 | 15.7 | $256.1B | Financial Services |
| 21 | LINDE PLC | LIN.DE | 0.75% | $2.9M | 5,884 | 33.8 | $200.9B | Basic Materials |
| 22 | INTL BUSINESS MACHINES CORP | IBM | 0.74% | $2.8M | 11,702 | 21.9 | $232.8B | Technology |
| 23 | META PLATFORMS INC-CLASS A | META | 0.73% | $2.8M | 4,878 | 24.0 | $1.4T | Communication Services |
| 24 | INTEL CORPORATION | INTC | 0.69% | $2.7M | 55,493 | -916.3 | $251.6B | Technology |
| 25 | MC DONALDS CORP | MCD | 0.68% | $2.6M | 8,471 | 25.6 | $219.2B | Consumer Cyclical |
| 26 | VERIZON COMMUNICATIONS INC. | VZ | 0.68% | $2.6M | 53,115 | 12.2 | $208.4B | Communication Services |
| 27 | APPLIED MATERIALS INC | AMAT | 0.66% | $2.5M | 7,198 | 35.3 | $276.5B | Technology |
| 28 | AT&T INC. | T | 0.64% | $2.5M | 86,918 | 9.3 | $198.2B | Communication Services |
| 29 | NEXTERA ENERGY, INC. | NEE | 0.63% | $2.4M | 26,244 | 28.5 | $194.1B | Utilities |
| 30 | MORGAN STANLEY | MS | 0.62% | $2.4M | 14,308 | 15.4 | $263.2B | Financial Services |
| 31 | THERMO FISHER SCIENTIFIC INC | TMO | 0.61% | $2.3M | 4,751 | 27.5 | $182.6B | Healthcare |
| 32 | PEPSICO, INC. | PEP | 0.60% | $2.3M | 14,872 | 26.1 | $214.6B | Consumer Defensive |
| 33 | ABBOTT LABORATORIES | ABT | 0.58% | $2.2M | 21,694 | 27.5 | $178.8B | Healthcare |
| 34 | WALT DISNEY COMPANY (THE) | DIS | 0.56% | $2.2M | 22,395 | 14.1 | $171.4B | Communication Services |
| 35 | CITIGROUP INC. | C | 0.54% | $2.1M | 17,949 | 14.7 | $201.6B | Financial Services |
| 36 | PFIZER INC. | PFE | 0.53% | $2.0M | 71,444 | 20.7 | $161.1B | Healthcare |
| 37 | CONOCOPHILLIPS | COP | 0.52% | $2.0M | 15,603 | 19.6 | $159.5B | Energy |
| 38 | ANALOG DEVICES, INC. | ADI | 0.51% | $2.0M | 6,164 | 57.5 | $155.4B | Technology |
| 39 | SALESFORCE INC | CRM | 0.49% | $1.9M | 10,206 | 23.5 | $175.4B | Technology |
| 40 | COCA-COLA COMPANY (THE) | KO | 0.49% | $1.9M | 25,008 | 25.2 | $330.0B | Consumer Defensive |
| 41 | BLACKROCK FUNDING, INC. | BLK | 0.48% | $1.8M | 1,911 | 27.0 | $150.3B | Financial Services |
| 42 | HONEYWELL INTL INC | HON | 0.47% | $1.8M | 7,967 | 28.4 | $145.9B | Industrials |
| 43 | CHARLES SCHWAB CORPORATION | SCHW | 0.46% | $1.8M | 19,218 | 18.8 | $166.6B | Financial Services |
| 44 | EATON CORP PLC | 0Y3K.L | 0.46% | $1.8M | 4,889 | 34.3 | $140.0B | Industrials |
| 45 | ADVANCED MICRO DEVICES, INC. | AMD | 0.46% | $1.8M | 8,411 | 81.8 | $354.6B | Technology |
| 46 | DEERE & COMPANY | DE | 0.45% | $1.7M | 3,050 | 32.3 | $155.5B | Industrials |
| 47 | WELLTOWER, INC. | WELL | 0.45% | $1.7M | 8,649 | 148.9 | $141.2B | Real Estate |
| 48 | BOEING COMPANY | BA | 0.44% | $1.7M | 8,193 | 71.6 | $163.5B | Industrials |
| 49 | LOWES COMPANIES INC | LOW | 0.43% | $1.7M | 7,056 | 19.4 | $129.7B | Consumer Cyclical |
| 50 | UNION PACIFIC CORP. | UNP | 0.43% | $1.7M | 6,875 | 20.3 | $145.2B | Industrials |